Dashboards

Grafana Plugin Tutorial: Polystat Panel (Part 1)

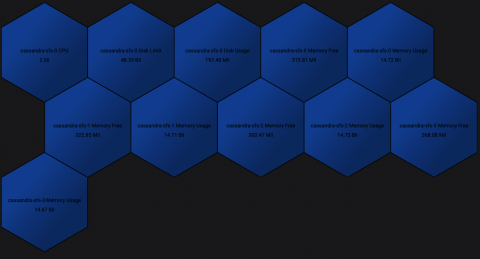
The grafana-polystat-panel plugin was created to provide a way to roll up multiple metrics and implement flexible drilldowns to other dashboards. This example will focus on creating a panel for Cassandra using real data from Prometheus collected from our Kubernetes clusters. We’ll focus on the basic metrics for CPU/Memory/Disk coming from cAdvisor, but a well-instrumented service will have many metrics that indicate overall health, such as requests per second, error rates, and more.

Tinder & Grafana: A Love Story in Metrics and Monitoring

Tinder is the world’s most popular dating app, with more than 26 million matches made each day. But two years ago, when it was time for the L.A.-based company to find and implement a perfect metrics monitoring partner, the process proved to be more slow-burn love affair versus whirlwind romance.

Icinga Camp Berlin 2019 | Dashboards for Your Management with Kibana Canvas by Philipp Krenn

This talk gives a quick overview of Kibana Canvas. First we are exporting some Icinga data to Elasticsearch and then we will turn to the special capabilities of Canvas — a new component of Kibana. It is both powerful and also a bit scary initially, since all you have is a white canvas on which you can arrange visualizations, logos, texts,… any way you want. We put together some screens, which are live updating and still ready for management.

Pro Tips: How Booking.com Handles Millions of Metrics Per Second with Graphite

More than 1.55 million room nights are reserved on the Booking.com platform every day. It’s a staggering amount of traffic, and not surprisingly, the Amsterdam-based travel e-commerce company has a lot of knowledge to share about handling metrics at scale.

GrafanaCon L.A. Recap: Grafana 6.0, LGTM, and More!

The rest of the city may still have been in a post-Oscars haze, but over 350 monitoring mavens gathered in downtown L.A. bright and early on Feb. 25 to kick off GrafanaCon 2019. The next two days were filled with 40+ talks, including Grafana end user stories from companies like Bloomberg and Tinder.