Operations | Monitoring | ITSM | DevOps | Cloud
Structuring Elasticsearch data with grok on ingest for faster analytics
As well as being a search engine, Elasticsearch is also a powerful analytics engine. However, in order to take full advantage of the near real-time analytics capabilities of Elasticsearch, it is often useful to add structure to your data as it is ingested into Elasticsearch. The reasons for this are explained very well in our schema on write vs. schema on read blog post, and for the remainder of this blog series, when I talk about structuring data, I am referring to schema on write.
Building a Python web application with Elastic App Search
This post is a brief summary of a presentation I gave recently where I deploy Elastic App Search, show off the ease of setup, data indexing, and relevance tuning, and take look at a few of the many refined APIs. It’s also written up in a codelab with step-by-step instructions for building a movies search engine app using Python Flask. The app will work on desktop or mobile and is a fast, simple, and reliable way to query the information.
Powering Khoros Community Platform using Elasticsearch
Optimizing costs in Elastic Cloud: Replica shard management
This is part of our series on cost management and optimization in Elasticsearch Service. If you’re new to the cloud, be sure to think about these topics as you build out your deployment. If you are yet to start, you can test out the content here by signing up to a 14-day free trial of Elasticsearch Service on Elastic Cloud.
Protect your Elasticsearch deployments against attacks like "meow bot" - for free
The issue of unsecured databases is growing. In 2019, 17 percent of all data breaches were caused by human error — twice as many as just a year before. And the IBM/Ponemon 2019 report found that the estimated probability of a company having repeated data breaches within two years grew by 31 percent between 2014 and 2019. Why is this happening?
Upgrading the Elastic Stack: Planning for success
"Upgrade" can be a four-letter word for admins, so at Elastic, we try to make the upgrade process as simple as possible. Why? Because we pack a ton of goodness into each release, but you can only take advantage of that goodness by being on the latest version of the Elastic Stack. This is also why we make the latest version available on Elastic Cloud the same day that we release.
Using Elastic supervised machine learning for binary classification
The 7.6 release of the Elastic Stack delivered the last piece required for an end-to-end machine learning pipeline. Previously, machine learning focused on unsupervised techniques with anomaly detection. However, several features have been released over the 7.x releases. In 7.2 Elasticsearch released transforms for turning raw indices into a feature index. Then 7.3, 7.4, and 7.5 released outlier detection, regression, and classification, respectively.
Elastic Workplace Search: Unified search across Dropbox and all your other content sources
Modern cloud storage tools such as Dropbox give teams the ability to easily share and centralize content, conveniently collaborate on projects, and sync data across devices. They’ve proven to be real productivity enhancers, especially with the expansion of work-from-home workforces. But cloud storage tools often end up being a dumping ground for lots of content and various clutter, making it clumsy at best (and next to impossible at worst) to find anything.
Optimizing costs in Elastic Cloud: Hot-warm + index lifecycle management
Welcome to our series on cost management and optimization in Elasticsearch Service. With the increased functionality in Elastic Cloud, it is now easier than ever to utilise many of the free and open features of the Elastic Stack to optimise your cloud deployment. This blog is a great resource for reviewing your existing high availability and data management strategies when it comes to cost management.
Detection rules for SIGRed vulnerability
On July 14, 2020, Microsoft released a security update related to a remote code execution (RCE) and denial of service (DoS) vulnerability (CVE-2020-1350) in Windows DNS Server (2003 - 2019).
The benefits of cloud education in pandemic times
Our new Elastic for Students and Educator program provides online resources and support to help you teach and learn no matter where you are. Hear from Luis Francisco Sánchez Merchante, an educator based in Spain, as he reflects on the challenges he’s faced while teaching during a global pandemic.
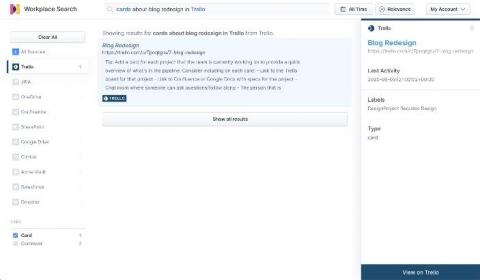
How to ingest data from Trello into Elastic Workplace Search
In our previous post, we introduced the concept of the Elastic Workplace Search Custom Source API as a means of adding data for which a prebuilt content source integration isn’t available. We used a simple example — a CSV file of contact information — to demonstrate the process along with the use of the associated REST API. In this post, we explore ingesting data from a more complex organizational source: Trello.
Enterprise Search- Search at Scale
Elasticsearch Python client now supports async I/O
With the increasing popularity of Python web frameworks supporting asynchronous I/O like FastAPI, Starlette, and soon in Django 3.1, there has been a growing demand for native async I/O support in the Python Elasticsearch client. Async I/O is exciting because your application can use system resources efficiently compared to a traditional multi-threaded application, which leads to better performance on I/O-heavy workloads, like when serving a web application.
Kubernetes observability tutorial: Monitoring application performance with Elastic APM
This post is the third in our Kubernetes observability tutorial series, where we explore how you can monitor all aspects of your applications running in Kubernetes, including: We’ll discuss using Elastic Observability to perform application performance monitoring (APM) with the Elastic APM.
Improve network security with traffic filters on Elastic Cloud
Today we are pleased to announce new traffic management features for Elastic Cloud. Now you can configure IP filtering within your Elastic Cloud deployment on Amazon Web Services (AWS), Google Cloud, and Microsoft Azure. We are also announcing integration with AWS PrivateLink. These features help give you greater control over the network security layer of your Elastic workloads.
Practical security engineering: Stateful detection
Detection engineering at Elastic is both a set of reliable principles — or methodologies — and a collection of effective tools. In this series, we’ll share some of the foundational concepts that we’ve discovered over time to deliver resilient detection logic. In this blog post, we will share a concept we call stateful detection and explain why it's important for detection.
Introduction into Eland - DataFrames and Machine Learning backed by Elasticsearch
macOS vs. Windows - What kernels tell you about security events: Part 2
This post continues this two-part blog series on further understanding the differences between macOS and Windows on the system level for effective endpoint security analysis. In Part 1, we covered process events. Here in Part 2, we’ll discuss file and network events. As with Part 1, my hope is to help cybersecurity professionals expand and enrich their experiences on a less familiar platform, ultimately helping them to be better prepared to face differences from past experiences.
Elastic Workplace Search on Elastic Cloud: Enabling greater flexibility and speed
We recently announced that Elastic Enterprise Search — our combined solution of search products — is now available to deploy as a single solution on Elastic Cloud. While Elastic App Search has been available on Elastic Cloud since early 2020, this is a new and exciting deployment option for Elastic Workplace Search.
Enabling DevSecOps with the Elastic Stack
Software development and delivery is an ever-changing landscape. Writing software was once an art form all its own, where you could write and deploy machine code with singleness of purpose and no concern for things like connecting to other computers. But as the world and the variety of systems that software supports became more complex, so did the ecosystem supporting software development.
Machine learning in cybersecurity: Detecting DGA activity in network data
In Part 1 of this blog series, we took a look at how we could use Elastic Stack machine learning to train a supervised classification model to detect malicious domains. In this second part, we will see how we can use the model we trained to enrich network data with classifications at ingest time. This will be useful for anyone who wants to detect potential DGA activity in their packetbeat data.
Elasticsearch sniffing best practices: What, when, why, how
Elasticsearch powers search experiences for so many tools and apps used today, from operational analytics dashboards to maps showing the closest restaurants with patios so you can get out of the house. And in all of those implementations, the connection between application and cluster is made via an Elasticsearch client. Optimizing the connection between the client and the Elasticsearch cluster is extremely important for the end user’s experience.
Kubernetes observability tutorial: Metrics collection and analysis
This post is the second in our Kubernetes observability tutorial series, where we explore how you can monitor all aspects of your applications running in Kubernetes, including: We’ll cover using Elastic Observability to ingest and analyze container metrics in Kibana using the Metrics app and out-of-the-box dashboards.
Introduction to Machine Learning in Elastic
Logstash and Maxmind - Not Just for GEOIP Anymore
macOS vs. Windows - What kernels tell you about security events: Part 1
How would you compare the Windows and macOS operating systems? In what ways are they similar? Why do they each take different approaches to solving the same problem? For the last 19 years I've developed security software for Windows. Recently, I’ve started implementing similar features on macOS. Since then, people have asked me questions like this. The more experience I gained on these two operating systems, the more I realized they’re very different.
Elastic introduces OpenTelemetry integration
We are pleased to announce the availability of the Elastic OpenTelemetry integration — available on Elastic Cloud, or when you download Elastic APM. This integration continues our to openness by embracing open standards support for the evolving OpenTelemetry standard for observability
New on Elastic Cloud: Self-service subscriptions, in-place configuration changes
We’re pleased to introduce you to the latest Elastic Cloud features and functionality. Grab a cup of your favorite beverage and five minutes, and let’s dive in.
Kibana platform migration: Lessons in large scale cross-team collaboration
When Kibana 4.0 was created back in 2015, it only had three apps: Dashboard, Visualize, and Discover. Fast forward five years, Kibana now consists of 100+ plugins, millions of lines of code, thousands of dependencies, and dozens of frameworks. The architecture of Kibana that worked well with three apps had become a bottleneck that was hindering Kibana’s stability, scalability, performance, and development velocity.


