Coralogix Deep Dive - Tracking Every Interaction with Tracing and APM
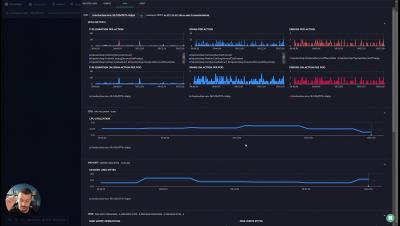
Coralogix Tracing and APM functionality offers a unique troubleshooting experience, with rich information density, without the need to context switch, with native support for Serverless, Kubernetes, EC2 and many other services, as well as an elegant, living architecture diagram that gives instant visibility to even the most complex components of your system.