Operations | Monitoring | ITSM | DevOps | Cloud
Tracing
The latest News and Information on Distributed Tracing and related technologies.
How to Monitor MongoDB Metrics with OpenTelemetry
Memcached Metrics Monitoring with OpenTelemetry
Enhance your visibility into OTel-instrumented apps in AWS Lambda
Enabling auto-instrumentation for your Lambda functions provides detailed insights into the performance and security of your serverless applications. Developers often also use custom instrumentation to fine-tune visibility and further tailor telemetry to their business needs. However, different teams within your organization might use a variety of instrumentation libraries, and achieving more granular visibility can come at the expense of data portability and interoperability.
Jaeger vs Zipkin: The Complete Comparison Guide
To monitor and troubleshoot the performance of microservice-based applications, Jaeger and Zipkin are examples of the most commonly used open-source distributed tracing systems. They both supply users with insight into the flow of requests through various components of a system, which can be utilized to find latency bottlenecks, errors, and performance problems in the system.
How to Monitor MySQL Metrics with OpenTelemetry
How to Collect .NET Application Logs with OpenTelemetry
How to Monitor Prometheus Metrics with OpenTelemetry Collector?
How to Monitor Apache Server Metrics with OpenTelemetry
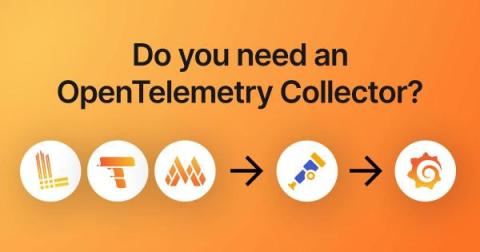
Do you need an OpenTelemetry Collector?
When you use OpenTelemetry SDKs to collect logs, metrics, and traces from infrastructure or an application, you’ll find many references to people using Grafana Agent and OpenTelemetry Collector. They start with an application or infrastructure that sends telemetry, and that data is sent to a collector, which then sends it to a backend like Grafana that may perform many functions, including visualization.


