Operations | Monitoring | ITSM | DevOps | Cloud

Announcing Grafana Mimir, the most scalable open source TSDB in the world

Today we’re introducing you to Grafana Mimir, the most scalable, most performant open source time series database in the world. Mimir allows you to scale to 1 billion metrics and beyond, with simplified deployment, high availability, multi-tenancy, durable storage, and blazing fast query performance that is up to 40x faster than Cortex. There’s supposed to be a video here, but for some reason there isn’t. Either we entered the id wrong (oops!), or Vimeo is down.
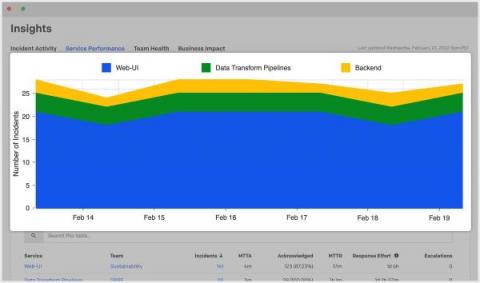

What's New: Updates to On-Call Management, Incident Response, Event Intelligence, Process Automation, and More!

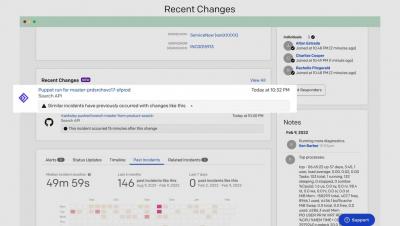
We’re excited to announce a new set of updates and enhancements to PagerDuty’s Digital Operations Platform. Recent updates from the product team include On-Call Management and Incident Response, Process Automation, to PagerDuty Community & Advocacy Events. New capabilities enable users and customers to resolve incidents faster, do the following, and more.

Elastic on Elastic - Using Elastic Observability to optimize the performance of detection rules in Elastic Security

Elastic Security’s developer support team has recently seen a surge in reports from customers about sluggish performance in our UI. Our initial inspection of logs for troubleshooting provided some insights, but not enough for a true fix. Luckily, we have Elastic Observability and its APM capabilities to dive in deeper and look under the hood at what was really happening within Elastic Security. And, more importantly, how we could improve its performance for customers.

PagerDuty: Event Intelligence for AIOps - Demo!

Noisy alerts and manual remediation can be things of the past. In this vidoe, learn about how your team can leverage Event Intelligence, a powerful AIOps solution from PagerDuty that helps teams harness machine learning to reduce alert noise, create context for faster resolution, and remove toil by automating repetitive tasks.

mooving to... Remote Work | Interview with Tech Expert Martha Sharpe

Remote work is becoming more and more commonplace, but the challenges of working remotely haven’t gotten any easier. Join us as software engineer, author, and adventurer Martha Sharpe discusses how she successfully navigated these challenges while working from the road in an RV.

How to set up Prometheus monitoring for your services

When you run applications in production, you need to monitor the infrastructure they run on - and collect important signals about application health like error rates and latency. In this episode of Engineering for Reliability with Google Cloud, Yuri will demonstrate how to instrument your service to expose application-specific telemetry with Prometheus and how to configure Google's managed service for Prometheus to collect those metrics.