Operations | Monitoring | ITSM | DevOps | Cloud

Java

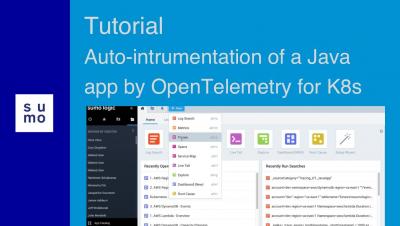
How to Instrument a Java App Running in Amazon EKS

As we start to see big moves from monolith deployments to microservices, the adoption of Kubernetes has become top of mind for many SREs. Organizations can leverage the open-source system to automate deployments, scale, and manage containers, making Kubernetes one of the primary solutions for delivering workloads. However, maintaining the system can be difficult and, in some cases, overwhelming.

Kotlin vs Java: 10 Years In

Java is as old as the Internet itself. It is the child of the mid-90s and exploded into the world just as dial-up started to take over suburban phone lines. In a way, it can be seen as the original Boomer of programming languages — not as elderly ancient as the C-families, but not as young and hip as JavaScript and its multitude of frameworks and libraries either.

Top 10 Java Linters

If you want to ensure code maintainability over the long term, you should follow best coding practices and style guide rules. One of the best ways to achieve this, while also potentially finding bugs and other issues with your code, is to use a linter. Linters are best described as static code analyzers because they check your code before it even runs. They can work inside your IDE, run as part of your build process, or be inserted into your workflow anywhere in between.

Instrumenting Java Applications for Tracing with OpenTelemetry and Jaeger

The aim of this article is to demonstrate how you can instrument a Java application using Opentelementry and Jaeger. In this example, we will be instrumenting our Java application using OpenTelemetry and the OpenTelemetry Java client, and the tracing data will be exported and visualized using Jaeger. We will use the Logz.io Jaeger backend as it is compatible with common tracing standards like Zipkin, OpenTelemetry, and OpenTracing.

How to Debug Race Conditions Between Threads in Java

How many days off have been marred by debugging race conditions and deadlocks in complex multithreaded, Java code? You’ve probably vowed, Never again and embarked on a quest to always catch race condition errors early by writing tests and debugging. Multithreaded applications are a great way to improve performance, but they also make routine tasks like debugging a little more complicated.

Key JVM Metrics to Monitor for Peak Java Application Performance

Monitoring is crucial if you want to see what happens in your system and JVM-based applications are not different. Well, some metrics, like memory and garbage collection, require special attention because they play a major role in your application performance. In this blog post, we will look into the key Java Virtual Machine (JVM) metrics that you should monitor if you care about performance and stability. Those are the memory, the garbage collection, and the JVM threads.

How to Monitor CPU Memory and Disk Usage in Java

In this post, we will discuss some of the primary commands, tools, and techniques that could help to monitor CPU Memory and Disk Usage in Java. The Java tools observe Java bytecode constructs and processes. Java Profilers follow all system commands and processor usage. This lets you look at call arrangement at whatever point you prefer.

Continuous deployment for Android libraries to Maven Central with Gradle

This article will take you through setting up CI/CD integration for building, testing, and publishing libraries to Maven Central using Gradle. With jCenter shutting down, Maven Central is once again the primary destination for all Android and Java libraries. Library publishers will need to port their libraries over to Maven Central to keep their libraries available after jCenter shuts down. This article focuses on CI/CD integration.

What is Java Memory Analysis

Java memory analysis is an important process in checking the performance of a Java application. It helps Java developers ensure the stability of the application by checking the memory consumption. There are several factors to look into when doing memory analysis. But to get to the bottom of this process, it is vital to learn first how memory works.

Getting Started with the Splunk Distribution of OpenTelemetry Java

Splunk Distro for OpenTelemetry is a secure, production-ready, Splunk-supported distribution of the OpenTelemetry project and provides multiple installable packages that automatically instruments your Java application to capture and report distributed traces to Splunk APM (no code changes required!), making it easy to get started with distributed tracing!