Operations | Monitoring | ITSM | DevOps | Cloud
Bring observability into Slack with Grafana AI
Resolve issues faster without leaving Slack. This video shows how Grafana Assistant delivers real-time insights, automates troubleshooting, and helps you investigate and act on incidents directly where your team already works. Thanks for watching!
Troubleshoot and monitor services with Grafana AI
Quickly diagnose issues and understand your systems with context-aware analysis. This video shows how Grafana Assistant helps you troubleshoot services, analyze dashboards, and generate new ones, all from simple prompts. Thanks for watching!
Turn knowledge into team-wide automation with Grafana AI
Make Grafana Assistant work your way by adding rules that capture your team’s context and best practices. This video shows how to customize behavior, improve efficiency, and turn tribal knowledge into repeatable workflows. Thanks for watching!
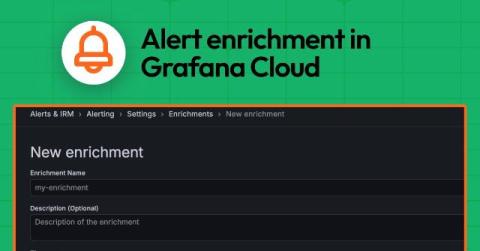
Grafana Alerting: Respond faster and get situational awareness with alert enrichment in Grafana Cloud
Alerts are meant to help teams respond quickly to problems, but too often they arrive without enough context to be immediately useful. An alert that says “CPU usage is high” still leaves the on-call engineer asking critical follow-up questions: Which service? Which environment? Where do I look next? Validating the alert and triaging the situation is the first step for every engineer. It's a manual step that takes time, extending every potential incident.
Top 5 ServiceNow Dashboarding Tools Compared
ServiceNow holds a wealth of operational data—but turning that data into dashboards people actually use is a different challenge altogether. Most teams start with what’s available out of the box. Then come the requests: At that point, dashboarding stops being simple. It then has to be “augmented” - with easy shareability, ease of use, contextualization and hierarchy.
Stop Wrestling With Complex Website Monitoring Dashboards
In the race to provide full-stack visibility, many modern SaaS platforms have inadvertently created a new problem: information overload. High-end enterprise solutions are designed for companies with dedicated Site Reliability Engineering (SRE) teams that spend their entire day inside a dashboard. But for many businesses, this level of granularity is a distraction. The real question isn’t whether a tool is powerful; it’s whether it fits the everyday needs of your team.
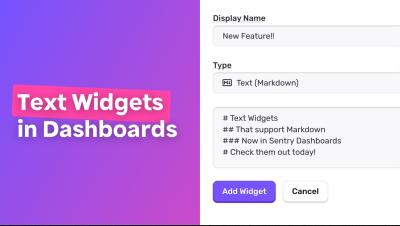
Text Widgets in Sentry Dashboards
We released a new type of dashboard widget - Text Widgets! You can use them to explain other widgets (good for onboarding), or even define your playbooks - instructions on how to investigate failures by reading the other widgets. They even support markdown!
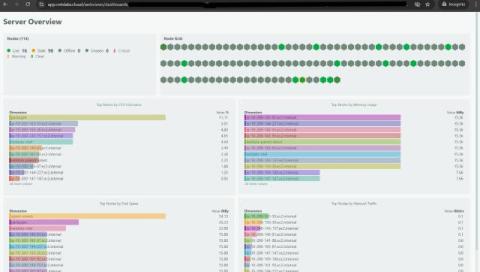
TV Mode: Put Your Dashboards on the Big Screen
One of the most common requests we’ve gotten since launching custom dashboards is deceptively simple: “How do I put this on a TV?” Teams want their dashboards on wall-mounted screens in NOCs, war rooms, and open office spaces. The dashboard is already built. The data is already there. They just need a way to display it on a screen that nobody is logged into, without exposing the full Netdata Cloud interface. TV mode does exactly this.
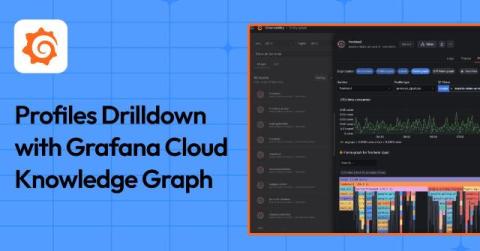
A faster way to pinpoint performance bottlenecks: Using Profiles Drilldown with Grafana Cloud Knowledge Graph
When you identify CPU or memory spikes in your services, it’s critical to understand why they’re happening. But switching between tools or crafting complex queries can slow you down when trying to pinpoint a root cause. This is why we’re excited to share that Profiles Drilldown, an application that lets you easily explore profiling data through an intuitive, point-and-click interface (no queries required), is now integrated with Grafana Cloud Knowledge Graph.


