Operations | Monitoring | ITSM | DevOps | Cloud

Dashboards

Grafana Cloud updates: The Explore apps suite for queryless data analysis, Adaptive Logs for cost optimization, and more

We consistently roll out helpful updates and fun features in Grafana Cloud, our fully managed observability platform powered by the open source Grafana LGTM Stack (Loki for logs, Grafana for visualization, Tempo for traces, and Mimir for metrics). And this month, on the heels of ObservabilityCON 2024 — our flagship observability event — we have no shortage of updates to share.

Explore Logs app now generally available | Grafana

In this video, Mat Ryer, Senior Principal Engineer at Grafana Labs, demonstrates how you can use the Explore Logs app to quickly gain insights from your data using a simple, point-and-click interface. Mat also discusses how you can use Explore Logs to drill down into your logs to investigate issues further, and how to use patterns to get rid of noise.

Explore Traces app now in public preview | Grafana

In this video, Mat Ryer, Senior Principal Engineer at Grafana Labs, provides an overview of the Explore Traces app for Grafana, which lets you automatically surface insights from your traces with an intuitive, point-and-click interface. Mat demonstrates how you can use the Comparison view to quickly identify the source of errors, and how to drill down to see a full trace in detail to gain a more comprehensive understanding of your system.

Contextual root cause analysis in Grafana Cloud

In this video, you will learn how to troubleshoot your application faster with Grafana Cloud Asserts, which provides contextual root cause analysis in Grafana Cloud. You'll learn how SLO alerts, the RCA (root cause analysis) Workbench, and prebuilt Grafana dashboards for Grafana Cloud solutions seamlessly work together to help you quickly investigate an issue.

Lower observability bills, reduced MTTR, and more: why companies migrate to Grafana Cloud

There are a lot of factors that go into choosing an observability solution. And even after all that careful consideration, sometimes the platform you initially invest in doesn’t meet your needs, especially as your organization grows and evolves. For that very reason, we’ve seen users begin their observability journeys with another tool, and then decide to migrate to Grafana Cloud, our fully managed cloud-hosted observability platform.

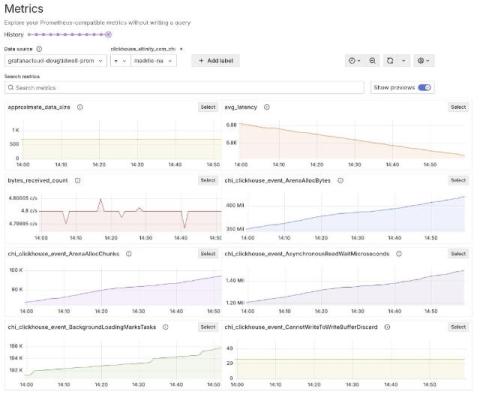
How to monitor metrics and logs from Altinity.Cloud in Grafana Cloud

Doug Tidwell is the Director of Content at Altinity, responsible for creating useful content for ClickHouse users in general and Altinity customers in particular. He has more than 30 years of experience in databases, CI/CD systems, development tools, and middleware. When it comes to visualizing, monitoring, and logging ClickHouse clusters, there’s no easier way to accomplish all three than with Grafana Cloud, the open and composable observability stack powered by open source.

Grafana OpenTelemetry distributions: prioritizing simplicity, sticking to OSS values

The OpenTelemetry (OTel) project offers numerous components and instrumentations that support different languages and telemetry signals. However, this flexibility can be overwhelming, and new users often struggle to choose the right components and configure them properly for their specific use cases. To address this, OpenTelemetry defines the concept of a distribution, a tailored and customized version of OpenTelemetry components.

Combining Data Visualization and Advanced Analytics for Stronger Data Insights

A typical enterprise generates a flood of information every day in the form of infrastructure and network data, operational and application data, security data, user access data, and more. With the right visualization capabilities, companies can thoroughly examine the multitudes of data they create daily to glean critical insights. The catch, however, is capturing actionable insights without exhausting the human resources of IT.