AIOps Insights from dashboards on Elastic Observability
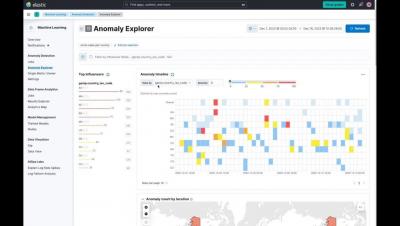
This video will show how you can analyze data on a specific chart on an Elastic dashboard to help you analyze that data and provide insights.


Data visualizations take complex information and present it in a clean and easy-to-understand visual. Done right, they can allow quick insight through easy pattern and outlier recognition. Done wrong, it can confuse, obfuscate, and lead to wrong conclusions. Yikes! Over the past few months, we've been hard at work modernizing Honeycomb’s data visualizations to address consistency issues, confusing displays, access to settings, and to improve their overall look and feel.
Application performance monitoring (APM) involves a mix of tools and practices to track specific performance metrics. Engineers use APM to monitor and maintain the health of their applications and ensure a better user experience. This is crucial to high quality architecture, development, and operations, but it can be difficult to achieve in Kubernetes since the container orchestration system doesn’t provide an easy way to monitor application data like it does for other cluster components.
Kubernetes makes it easier for businesses to automate software deployment and manage applications in the cloud at scale. However, if you’ve ever deployed a cloud native app, you know how difficult it can be to keep it healthy and predictable. DevOps teams and SREs often use distributed tracing to get the insights they need to learn about application health and performance.
Observability has become a bit of a buzzword in the industry for the last few years. Exactly what "observability" means depends on who you ask, but most people would agree its about both: There's plenty of content out there telling you how to implement observability, or what good looks like. But what about bad observability? What are some anti-patterns to watch out for?
Kubernetes monitoring can be difficult and complex. In order to determine the health of your project at every level, from the application to the operating system to the infrastructure, you need to monitor metrics in all the different layers and components — services, containers, pods, deployments, nodes, and clusters.
ESnet (Energy Sciences Network) is a high-performance network backbone built to support scientific research. Funded by the U.S. Department of Energy and part of Lawrence Berkeley National Laboratory, ESnet provides fast, reliable connections between national laboratories, supercomputing facilities, and scientific instruments around the globe. Our mission is to allow scientists to collaborate and perform research without worrying about distance or location.
Kubernetes, a graduated project of the Cloud Native Computing Foundation (CNCF) ecosystem, is the most prominent and widely used container orchestration systems. It’s used to manage and deploy containers in a wide range of environments, from IoT devices based on Raspberry Pis to enterprise environments consisting of millions of services.
You’re part of a data-driven engineering team. You have a rich, complex, and dynamic set of tools but you’re struggling to discover and share insights from all that data. So, you're looking for a platform that will help unify it all. Naturally, you want to compare Grafana vs. Power BI - the big names. Plus, there's a new player on the block - SquaredUp.


