How to do continuous profiling right with Grafana Pyroscope's Ryan Perry (Grafana Office Hours #26)
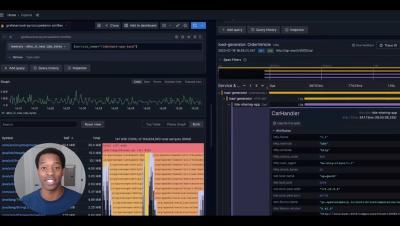
Ryan Perry, co-founder of Grafana Pyroscope, talks to us about how to do continuous profiling right. Ryan is also an Engineering Director at Grafana Labs, and he discusses the main concerns in continuous profiling and how to avoid those pitfalls. Pyroscope is an open-source project for aggregating continuous profiling data about your system's resources. He is joined by Developer Advocates Nicole van der Hoeven and Paul Balogh.