Operations | Monitoring | ITSM | DevOps | Cloud

IoT

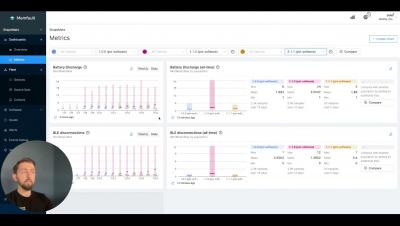
Feature Highlight Rollup by Cohort or by Software Version

In this video, I will be showcasing our newly released metric chart type called "Rollup by Cohort or by Software Version." This chart type provides an overtime view of your metric performance, allowing you to compare between software versions or cohorts. Unlike the existing chart types, which have an eight-week time window limitation, this new view enables absolute comparisons of performance across software versions. I will demonstrate how to make performance comparisons and explain the benefits of using this chart type. If you have any questions, please reach out to our team.

Simplified Debugging with the Device Timezone Feature in Memfault

In this quick demo, Jesse Dukes introduces you to Memfault's Device Timezone feature. This feature allows users to adjust the timezone, ensuring that all information viewed in Memfault is contextualized for that session. We made updates to the feature to help international teams working with globally deployed devices to contextualize, coordinate and collaborate.

Matter, Thread, and Memfault

I’m Markus, software engineer @ Tridonic, where we are working on Internet-connected wireless lighting solutions based on the Matter standard. To be able to monitor the reliability of those devices we’ve been using Memfault and tied it into Matter/Thread and its UDP/IPv6 stack based on the Nordic Connect SDK. In the following, I’ll show you the modifications we’ve done to enable Memfault in an IPv6 solution. Like Interrupt?

From Concept to Launch: What It Takes to Build and Ship a New Device

Our panel of embedded engineering experts has decades of experience building complex IoT products for successful launches across different industries. They’ve seen and triaged countless issues and will provide you with insights they’ve learned throughout their careers. Learn everything it takes to successfully ship a new embedded device.

An Introduction to Memfault's IoT Reliability Platform

Memfault's platform includes device debugging, performance monitoring, and over-the-air update capabilities. These not only help streamline the device development process and quickly identify and resolve issues; but additionally provide insights into your device performance, identify trends, and proactively address potential problems before they impact users. Watch to see a demo of our IoT reliability platform.

Monitoring Your IoT Devices Using Mosquitto and Graphite

Monitoring IoT devices is a very important process for analyzing their behavior and ensuring their performance. You need to choose the right monitoring tools to effectively collect and analyze metrics. In this article, we will learn how to monitor your IoT devices using Mosquitto and Graphite. You will also find out what benefits you can get using a Hosted Graphite solution from MetricFire. Check out MetricFire’s free trial to test all the features it provides.

Optimize Industrial IoT Data with InfluxDB and AWS

The modern factory’s relationship with data is experiencing a major change. Data now shapes the future rather than only telling the story of the past. The language inside the factory sounds like higher Overall Equipment Effectiveness (OEE) as the result of a shift from preventive to predictive maintenance. It could also look like expanding business goals to a new market based on impactful data-driven decisions. A change in purpose requires an update in technology.