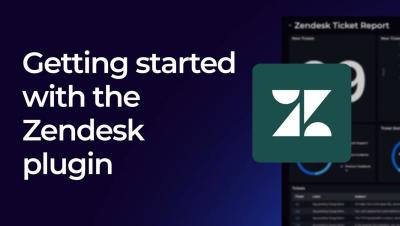
Operations | Monitoring | ITSM | DevOps | Cloud

SCOM

The latest News and Information on Service Center Operations Manager and related technologies.

New release MetrixInsight for CVAD - v1.4.21000.x

GripMatix is Citrix partner and market leader providing SCOM Management Packs for monitoring Citrix Virtual Apps and Desktops, Citrix License Server, Citrix Provisioning Services, Citrix StoreFront and Application Delivery Controller, formerly known as Citrix NetScaler. Our solutions have been tested and verified within the Citrix Ready program. Besides quality updates, we continuously work on developing new features to improve your Business Continuity and Performance even further.

A successful Monitoring as a Service Case: Drilling & Mining Industry

Migrating or restructuring a SCOM environment can seem like an overwhelming, even impossible, task. For one of our customers in the mining industry, however, it went more than well, and the improvements have been exceptional. Applying our Monitoring as a Service, they could benefit from the aggregated experiences of programmers, system administrators, and DevOps engineers that our service builds on to make the migration as smooth and trouble-free as possible.

Dashboard Fridays: Sample PagerDuty Alerting dashboard

Adam Kinniburgh is back with another Dashboard Fridays episode, this time joined by Ashley Thompson as they showcase this example PagerDuty Alerting dashboard. This dashboard gives an overview of alerting sent to PagerDuty from any source, even external sources like Pingdom.

What are Webhooks and why do they matter to SCOM?

A Webhook is an API that delivers data from applications when an action or event occurs. When an event is triggered within the source site, it is seen by the Webhook, which collects the data and sends it to the desired application or URL in the form of an HTTP request. Webhooks are also instant, triggering the delivery of data in real-time, this makes them faster and easier to implement than other methods, like polling.

NiCE VMware Management Pack 5.4 released

The NiCE VMware Management Pack 5.4 is an enterprise-ready Microsoft SCOM add-on for advanced VMware vSphere and ESXi monitoring. It supports the VMware administrator in centralized vSphere and ESXi health and performance monitoring to improve user experience and business results. The new NiCE VMware Management Pack 5.4 comes with new features, such as extensive vSAN monitoring options, vCenter Service monitoring, Snapshot management, Datastore Provision monitoring, as well as Certificate tracking.

VMware Management Pack Update Release (21.11.2612.0)

Finally, It's time for a new VMware management pack release, and yes, we heard you! A while ago we asked for your input and feedback in a customer survey. We worked hard to optimize and add new features according to your requests. Some most significant features are mentioned and described in depth below, while you will find all newly added features, changes, and improvements in the release notes.

Key Takeaways from our digital SCOM Usergroups

After almost two years living with a pandemic that changed the way we live and, not the least - the way we work, we are happy to say that we just finished the first events in quite a long while. What used to be very successful "live events" have now turned into online, digital ones, and though it's not quite the same, we are pleased that the participation was high and feedback positive.

Build VS Buy: How to get the most out of your SCOM monitoring

Microsoft's System Center Operations Manager, SCOM, is one of several monitoring platforms available on the market. It is widely adopted and has great potential to help you create a stable and robust IT environment. To succeed with that, however, is not always straightforward. To fully benefit from SCOM, the right resources need to be in place and optimized- time, competence, and money.

Dashboard Fridays: Example SQL Samples Dashboard

Join SquaredUp's Adam Kinniburgh and fellow virtualisation expert Shawn Williams as they showcase this SQL Sample dashboard. This dashboard was designed to demonstrate how the same base SQL query could be used with each of SquaredUp’s visualizations. Each SQL visualization slightly modifies how the data is presented to target user requirements. Tune in to learn how it was made, the challenges it solves, and Shawn's top tips for building it yourself.

Dashboard Fridays: Sample Symantec Endpoint Protection (SEP) Dashboard

Join SquaredUp's Adam Kinniburgh and SCOM community hero Ruben Zimmermann as they showcase this example SEP Dashboard. Giving an overview of the status of the various endpoint protection systems, this dashboard is used by the IT team to keep on top of device security, and by the service desk to escalate appropriately.