Operations | Monitoring | ITSM | DevOps | Cloud
Netdata, Prometheus, Grafana Stack
In this blog, we will walk you through the basics of getting Netdata, Prometheus and Grafana all working together and monitoring your application servers. This article will be using docker on your local workstation. We will be working with docker in an ad-hoc way, launching containers that run /bin/bash and attaching a TTY to them. We use docker here in a purely academic fashion and do not condone running Netdata in a container.
Netdata Processes monitoring and its comparison with other console based tools
Netdata reads /proc/
Netdata QoS Classes monitoring
Netdata monitors tc QoS classes for all interfaces. If you also use FireQOS it will collect interface and class names. There is a shell helper for this (all parsing is done by the plugin in C code - this shell script is just a configuration for the command to run to get tc output). The source of the tc plugin is here. It is somewhat complex, because a state machine was needed to keep track of all the tc classes, including the pseudo classes tc dynamically creates. You can see a live demo here.
Mobile APP teaser and eBPF functions! | Netdata Office Hours #6
Our first ML based anomaly alert
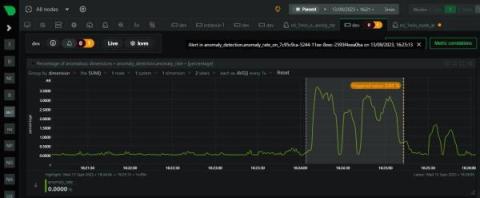
Over the last few years we have slowly and methodically been building out the ML based capabilities of the Netdata agent, dogfooding and iterating as we go. To date, these features have mostly been somewhat reactive and tools to aid once you are already troubleshooting. Now we feel we are ready to take a first gentle step into some more proactive use cases, starting with a simple node level anomaly rate alert. note You can read a bit more about our ML journey in our ML related blog posts.


