Operations | Monitoring | ITSM | DevOps | Cloud

December 2020

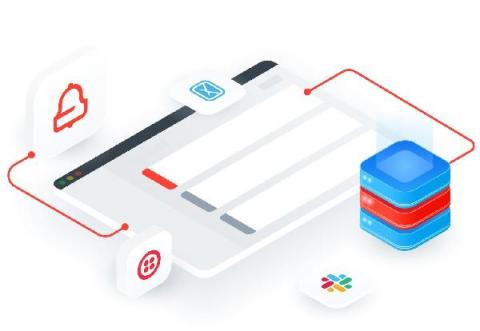
Centralize the truth of your infrastructure with alarm notifications

Netdata is architected on every level, across both the open-source Netdata Agent and Netdata Cloud, to help you own every layer of your monitoring experience. With this design, all metrics data collected by the Netdata Agent stays distributed on your node, but you also leverage Netdata Cloud’s dashboards and multi-node visualizations to view the health and performance of an entire infrastructure from a single application.

Netdata and StackPulse: Per-second metrics meet automated remediation

Teams of all types use Netdata to monitor the health of their nodes with preconfigured alarms and real-time interactive visualizations, and when incidents happen, they troubleshoot issues with thousands of per-second metrics on Netdata Cloud. But based on the complexity of the team and the infrastructure they monitor, some parts of their incident management, such as pre-planned communication and escalation processes, or even automated remediation, need to happen outside of the Netdata ecosystem.

Community update: Discourse, community efforts

Open source and community have always been in the DNA of Netdata, with the Agent starting as a very popular open-source project. Since then, a lot has changed, with Netdata maturing into a company, and the Netdata Agent finding its place as an open-source project in a wider offering that redesigns the monitoring experience from the ground up.