Operations | Monitoring | ITSM | DevOps | Cloud
Netdata's dashboard: open by default and secure by design
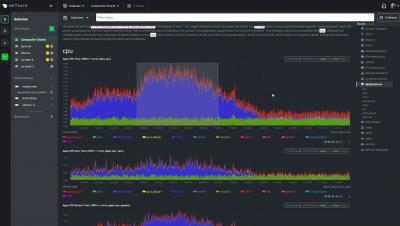
Let’s talk through a scenario: You have a Linux-based VM running on DigitalOcean (aka a Droplet), and you install Netdata on it using our recommended kickstart script. As the installation process winds down, the Droplet starts up the Netdata Agent’s web server and serves the local Agent web dashboard on port 19999.
Bringing rich and real-time infrastructure monitoring to Netdata Cloud
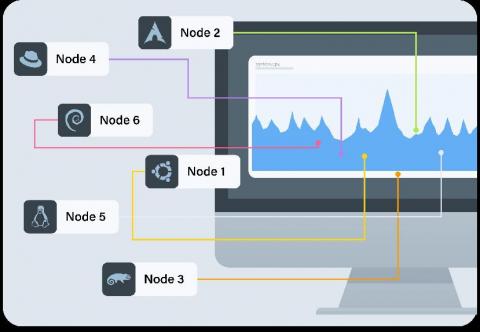
The Netdata Agent is well-equipped to solve monitoring and troubleshooting challenges for single nodes. We love that the Agent is so valuable to our users, but Netdata Cloud is designed for infrastructure monitoring. That’s why we’re working so hard to offer even more capabilities and help users monitor and troubleshoot infrastructures of all sizes, entirely for free!
The reality of Netdata's long-term metrics storage database
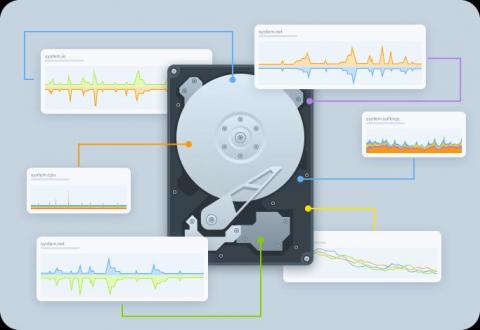
The perception that Netdata is only capable of short-term metrics storage is a myth. It’s a pervasive myth we still see in blog posts and through community engagement, despite it being false for more than a year. However, like all myths, this one on metrics storage began with a kernel of truth. When Netdata first flourished as an open-source project in 2017 and 2018, the default metrics database was RAM-only.
How to monitor Windows systems with Netdata
Whether you’re a site reliability engineer (SRE), DevOps engineer, or any other role that plays a part in maintaining uptime for your company’s infrastructure, it’s critical to have visibility into all of your systems, regardless of their operating system. This includes monitoring Windows systems, which is a popular use case for Netdata’s community. Here’s the caveat: Netdata has no native Windows monitoring agent.


