Operations | Monitoring | ITSM | DevOps | Cloud

January 2021

Actionable alerts with fewer false positives: intelligent alarms with Netdata

Think about any sport or competitive activity, whether that’s football or a spelling bee. They always feature at least one person who acts as a moderator, referee, or judge. With their domain expertise, this person watches everyone’s behavior and constantly compares that against a set of rules. If someone crosses that threshold, they blow a whistle or throw up a flag. They are, in effect, saying that things have gone from OK to not OK.

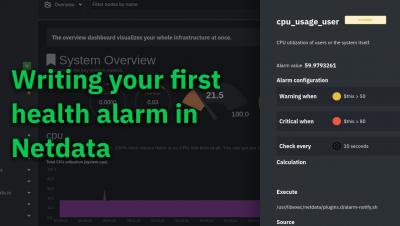
Creating your first health alarm in Netdata

The per-second metrics and interactive visualizations in the Netdata Agent don’t mean much if you don’t know what you should be looking at, or whether anything is going wrong on your node in the first place. That’s why Netdata has a built-in health watchdog to notify you when metrics show an anomaly or full-blown incident that demands your immediate attention. Every Netdata Agent comes with hundreds of preconfigured charts that you don’t need to edit in order to take advantage of, but you may want to create your own based on your infrastructure, node, workload, or applications.

Four key metrics for responding to IT incidents and failures

If you’re a veteran in this space, you probably understand the many incident response metrics and concepts, along with the many (at times exasperating) acronyms. For those new to the space, or even those with years of experience, the terminology is often overwhelming. If you’re one of those people who’s struggling to navigate through the world of DevOps metrics, we’ve created this article for you.