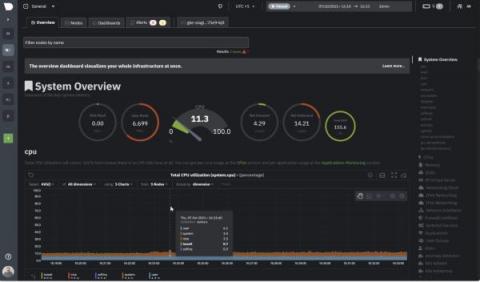
All-new Netdata Cloud Charts 2.0
Netdata excels in collecting, storing, and organizing metrics in out-of-the-box dashboards for powerful troubleshooting. We are now doubling down on this by transforming data into even more effective visualizations, helping you make the most sense out of all your metrics for increased observability. The new Netdata Charts provide a ton of useful information and we invite you to further explore our new charts from a design and development perspective.


