Operations | Monitoring | ITSM | DevOps | Cloud

Observability

The latest News and Information on Observabilty for complex systems and related technologies.

Eaze into Observability

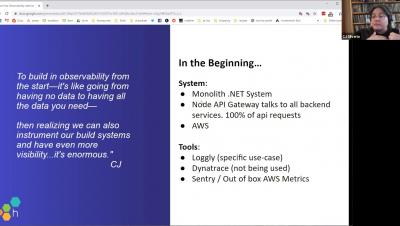
On-call teams use Honeycomb’s analytics to discover exactly what is happening with code in production. While incident response is a key reason engineers rely on Honeycomb, observability also delivers unique value during the development process. Eaze takes observability a step further and uses Honeycomb to prioritize what’s needed to stabilize their existing service while informing how they build their new Go and Node.js microservices platform all at the same time.

Why Is Designing an Effective Application Logging Strategy Important?

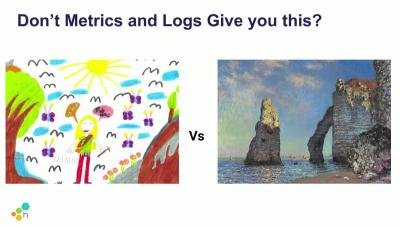
Observability is made up of metrics, logs, and traces. These pillars help us understand the behavior of applications under normal execution, which further accelerates identifying anomalies in case of application failure or deviation from normal execution. Logging is not about tracing each and every operation, it is about sensible, consistent, and machine-readable log messages that expose the application behavior.

Handle Unruly Outliers with Log Scale Heatmaps

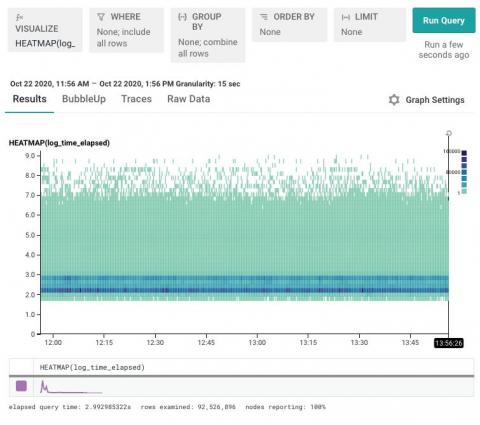
We often say that Honeycomb helps you find a needle in your haystack. But how exactly is that done? This post walks you through when and how to visualize your data with heatmaps, creating a log scale to surface data you might otherwise miss, and using BubbleUp to quickly discover the patterns behind why certain data points are different.

Honeycomb Learn Ep 1 Instrument Better for a Happy Debugging Team

Nathan LeClaire, Sales Engineer @honeycombio knows first-hand that the key to instrumenting code is to start with baby steps. With Honeycomb, a little instrumentation will give vast insights as soon as you ingest your data. With Honeycomb Beelines, we take the heavy lifting out of instrumenting. Listen to learn: See Honeycomb in action, hear best practices, and learn how fast and painless instrumentation can be.

Honeycomb Learn Ep. 2: De-stress Debugging -Triggers, Feature Flags, & Fast Query

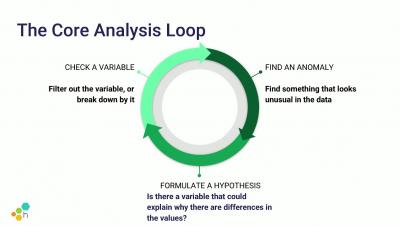
This episode in our Honeycomb Learn series looks at how to cut stress levels when debugging issues in production. Starting with a hypothesis, run fast queries, and then navigate to the code where the problem lies. Be proactive and set triggers to let you know if something needs attention. When engineering is about to ship a new release, set a feature flag to watch how production behaves in real-time. Curtail performance issues and reduce customer impact with the right tools to better understand production systems, right now.

Honeycomb Learn Ep. 3: See The Trace? Discover Errors, Latency & More across Distributed Systems

Distributed systems bring complexity for developer and ops teams. When incidents occur in production, expected and unexpected, you want to pinpoint which part of the service is giving problems. Distributed tracing illuminates distributed systems, making your logs easier to navigate. Quickly identify where there are errors or latency in your code or service, even within 3rd party services you use. Instrumentation is the key to the best tracing experience possible.

Honeycomb Learn Ep. 4: Bubble-Up to Spot Outliers in Production

The power of Honeycomb lies in the way you analyze production data using different interactive views. See what's happening across many dimensions (fields) in your system with BubbleUp. Pick the timeframe, breakdown by any field, such as customer name or ID, then filter by a specific dataset or where any errors occur. The query results are heatmap that highlight events over the baseline, over time. Use BubbleUp to select outliers on the heatmap and drill down to all related fields in that data. It will help you understand which part of the code is misbehaving.

Honeycomb Learn Ep 5 Never Alone On Call

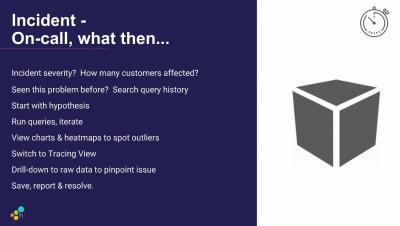
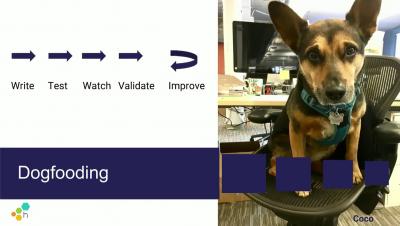
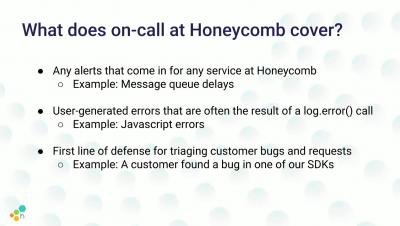
In this webinar, we’ll discuss and show how: Honeycomb's query history gives rich meaningful context, Honeycomb’ers dogfood and learn from each others' compound wisdom, benefits span engineering cycles and use-cases when debugging and maintaining, & to build a culture of observability and why you should do it now.

How Dashbird Atlas Accelerates Serverless Observability

Share When it comes to serverless applications, their distributed nature of exponential scalability and use of potentially thousands of resources automatically begs the need for observability. Using the mass data output of an application to understand and optimize the internal states is a game-changing strategy, but only if used well. Dashbird Atlas takes serverless observability to a new level, reducing excessive noise through simple visualization of your application.

Coralogix - On-Demand Webinar: Scaling Observability

In today’s fast-moving era of technology with increasing levels of abstraction and separation between application and infrastructure, it’s important for us to be able to understand exactly what our CI/CD processes are doing. We need to be able to quickly monitor deployment health just as we would application health. Chris Cooney, Senior Cloud Engineer, Sainsbury's Digital, Tech and Data Ariel Assaraf, Co-Founder and CEO at Coralogix