Yesterday at KubeCon + CloudNativeCon EU, Grafana Labs software engineer Marco Pracucci, a Cortex and Thanos maintainer, teamed up with Thor Hansen, a software engineer at Hashicorp, to give a presentation called “Scaling Prometheus: How we got some Thanos into Cortex.” In their talk, the pair discussed a new storage engine they have built into Cortex, how it can reduce the Cortex operational cost without compromising scalability and performance, and lessons learned from running Cortex at s
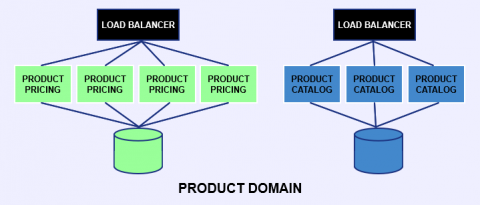
At LogicMonitor, we deal primarily with large quantities of time series data. Our backend infrastructure processes billions of metrics, events, and configurations daily. In previous blogs, we discussed our transition from monolith to microservice. We also explained why we chose Quarkus as our microservices framework for our Java-based microservices. In this blog we will cover.

As we enter into our 4th year, we've decided to get up close and personal with our team to share with you their passion, drivers, lessons learned and significant moments of the past year. We're a young company dedicated to adding value in all corners that we reach, so we hope you find the upcoming series useful! Hey Marek, so can you tell us how long you’ve been at Dashbird and where you were before? M: I’ve been at Dashbird for two years now.
Microservice architecture is widely popular. The ease of building and maintaining apps, scaling CI/CD pipelines, as well as the flexibility it offers when it comes to pivoting technologies are some of the main reasons companies like Uber and Netflix are all in on this approach. As the amount of services in a microservice architecture rises, complexity naturally also rises.
At LogicMonitor, we are continuously improving our platform with regards to performance and scalability. One of the key features of the LogicMonitor platform is the capability of post-processing the data returned by monitored systems using data not available in the raw output, i.e. complex datapoints. As complex datapoints are computed by LogicMonitor itself after raw data collection, it is one of the most computationally intensive parts of LogicMonitor’s metrics processing pipeline.