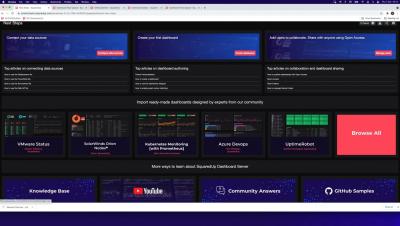
SquaredUp v5.3 continues to help companies reduce tool sprawl and increase observability. With a focus on our most requested features, this release includes impressive improvements to our visualisations.
Reduce the pressure on support by empowering end-users to immediately resolve their own issues. Fewer support tickets, shorter response times, happier customers. Automated, smart self-serving support. Its just that easy.
Support teams spend most of their time repeatedly fixing the same issues in the same way. The Pulseway client portal allows you to automate these resolution paths while giving end-users immediate responses to common issues. By reducing the support load, you have more time to focus on proactive, higher-value activities, while users no longer wait in support queues.
With Sleuth, you can instantly and automatically track the four DORA metrics: Change Lead Time, Deploy Frequency, Change Failure Rate, and MTTR. No more, no less. Sleuth tracks them accurately, doesn't attempt to track dubious individual metrics, and doesn't require any manual work. SLEUTH A deploy-based Accelerate Metrics tracker both managers and developers love.
Setting up Sleuth is easy a caveman can do it 😜 Seriously, all you need to do is enable a few integrations with tools in your toolchain, plus one extra optional step that'll signficantly improve the accuracy of your DORA metrics. SLEUTH A deploy-based Accelerate Metrics tracker both managers and developers love.
The time it takes to get a change into production, also known as Change Lead Time, is an important measure of developer productivity, and one of the four DORA metrics. In Sleuth, you can easily break down Change Lead Time into activities to get insights into potential bottlenecks. SLEUTH A deploy-based Accelerate Metrics tracker both managers and developers love.
Meet "Workflow" from Komodor, the feature that automates troubleshooting common errors in Kubernetes. Leveraging Komodor’s change intelligence capabilities, Workflow's smart algorithm automatically detects Kubernetes issues and responds with a series of checks that quickly pinpoint its root cause. Not stopping there, Komodor uses the information to provide made-to-measure instruction for remediation, turning troubleshooting into a fast and effortless experience for dev and ops.
We learned from a visually impaired astronomer that it was possible to use sonification to understand astronomical spectra. So during a hackathon at Grafana Labs we decided to turn time series into audio, and add sound to our alerting systems too. Kostas Pelelis is a Software Engineer at Grafana Labs living in Greece.
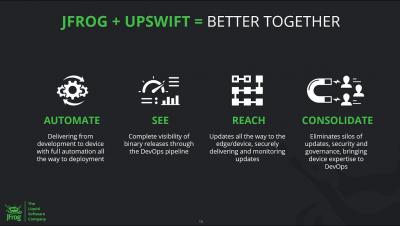
JFrog has acquired Upswift to bring the world of connected devices into the DevOps pipeline! Managing fleets of devices and edge applications remotely - including over-the-air (OTA) updates, security, monitoring, controlling and more - has quickly become unwieldy for most companies, with growth of connected devices expected to reach 24 billion in 2026. But, most of today’s DevOps solutions are not optimized or built to deliver software updates to distributed edge and IoT environments.