Operations | Monitoring | ITSM | DevOps | Cloud

Latest Posts

Introducing the Lightstep Metrics plugin for Grafana

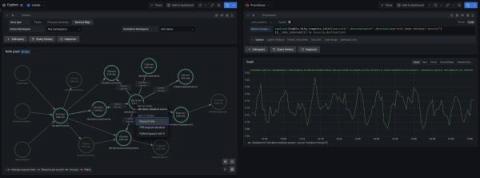
Chris Sackes is a Software Engineer at Lightstep. A New Yorker by birth, he loves public transportation, architecture photography, and urban exploration. He’s spent the last five years engineering delightful user experiences for a variety of applications. Lightstep’s powerful metrics reporting and analysis are now available for Grafana users. Using the new Lightstep Metrics plugin for Grafana, you can view metrics data reported to Lightstep directly in your Grafana instance.

Reduce costs and increase performance with query caching in Grafana Cloud

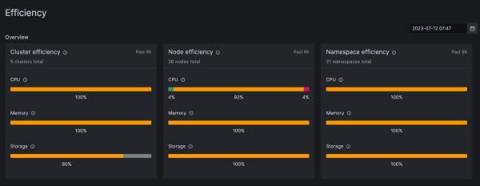
We are excited to announce the launch of query caching in Grafana Cloud, which can significantly reduce load times and costs of your most popular Grafana dashboards. Now, when the same query is submitted repeatedly, the results will come back from the cache rather than the data source itself. This not only lowers load times for popular dashboards, but will also reduce API costs for your data sources and decrease the likelihood that those APIs will rate-limit or throttle requests.

How Istio, Tempo, and Loki speed up debugging for microservices

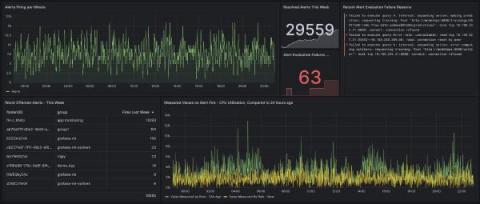
“How am I supposed to debug this?" Just imagine: Late Friday, you are about to shut down your laptop and … an issue comes up. Warnings, alerts, red colors. Everything that we, developers, hate the most. The architect decided to develop that system based on microservices. Hundreds of them! You, as a developer, think why? Why does the architect hate me so much? And then, the main question of the moment: How am I supposed to debug this?

Introducing the Honeycomb plugin for Grafana

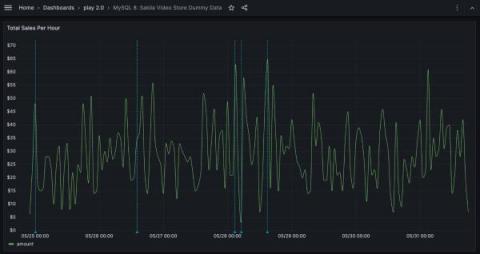
Over the years, we’ve heard many versions of the same familiar story: large businesses struggling with observability data living in several different systems. At Grafana Labs, our “big tent” philosophy is based on the belief that our users should determine their own observability strategy and choose their own tools. Grafana allows them to bring together and understand all their data, no matter where it lives.

Grafana Tempo 1.1 released: New hedged requests reduce latency by 45%

Grafana Tempo 1.1 has been released, and like our major version suggests, there are no breaking changes. If you’d like, please check out the release notes . But if you find that release notes can sometimes be difficult to decode, fret not! All the highlights are below.

What's new in Grafana Enterprise Metrics 1.5: Per-tenant usage metrics and a wildcard tenant for queries

We’re thrilled to announce the release of Grafana Enterprise Metrics (GEM) 1.5. While this release packs in a ton of enhancements and bug fixes, we’d like to dive into two particularly exciting features: per-tenant usage metrics and a wildcard tenant for queries.

How we're supporting the success of our community and customers with our recent funding rounds

This morning, we announced that Grafana Labs has raised $220 million in Series C funding . As with our previous rounds in 2019 and 2020 , this funding will enable us to focus on accelerating the development of our open source observability platform and supporting the success of our community and our customers.

How we use the k6 load-testing tool for developing Grafana

On the last day of GrafanaCONline in June, our CEO Raj Dutt announced that Grafana Labs had acquired k6 , the company behind the open source load-testing tool. In fact, our relationship with k6 had started more than two years earlier. At the beginning of 2019, we were working on replacing Grafana’s “remember me” cookie solution with a short-lived token solution for the Grafana 6.0 release.

How an observability consulting company solved a client's monitoring issues with Grafana Cloud

Companies are always looking for transparency and visibility when it comes to monitoring, but as monitoring requirements and methods evolve, it’s not always easy to keep up. That’s why Opsdis, an observability consulting company based in Göteborg, Sweden, was founded. The firm focuses solely on helping clients implement systems for monitoring and metrics so they can keep up with the ever-expanding world of cloud computing and containerized environments.

How we fixed a double-counting Prometheus bug while working on a Grafana Cloud project

In my role as a software engineer at Grafana Labs, I recently worked on a project that involved generating PromQL queries. One of the ways we verified the correctness of the generated queries was with a suite of integration tests. These tests would execute the generated PromQL queries against a local instance of the Prometheus query engine with some test data, and verify the results were as expected.