Operations | Monitoring | ITSM | DevOps | Cloud

Latest Posts

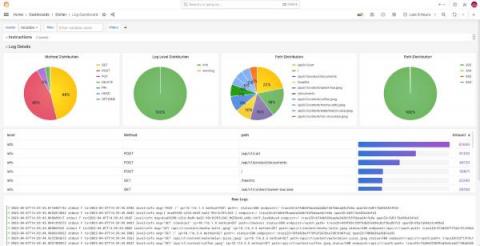
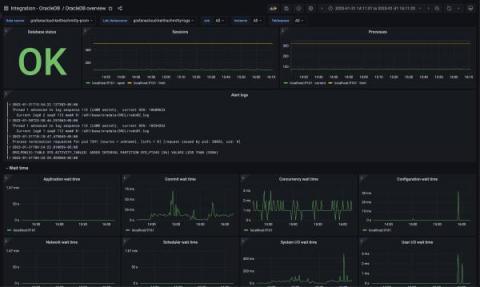
Grafana dashboard showcase: Visualizations for Prometheus, home energy usage, GitHub, and more!

The Grafana community is one of the most vibrant in all of web development. And to celebrate the conclusion of GrafanCONline, the launch of Grafana 8 and Tempo 1.0, and so much more, we’re pleased to share this dashboard showcase. (And in case you missed any of the great sessions at GrafanaCONline, the videos are available on demand now!) Each of these 12 dashboards was built by our community, for our community.

GrafanaCONline Day 6 recap: The latest on Loki for logs, Grafana for monitoring high performance computing, the business of Grafana Labs, and more!

GrafanaCONline 2021 has ended! Thank you to everyone who tuned in and to all of our presenters. If you’d like to relive any moment, it’s not too late to sign up to get notified about on-demand access to all the session recordings, which will be available soon. If you didn’t get a chance to watch Thursday’s presentations, here’s what you missed from Day 6 of the conference.

GrafanaCONline 2021 Day 5 recap: Grafana alerting, dashboards as code, synthetic monitoring in Grafana Cloud, and more!

GrafanaCONline 2021 is still going strong and you can tune in live (for free!) or sign up to get notified about on-demand access to all the session recordings, which will be available after GrafanaCONline ends. Here’s what you missed on Day 5 of the conference.

GrafanaCONline IoT Day recap: Real-time streaming in Grafana 8, fun DIY projects, Grafana for trains, plants, and more

Week two of GrafanaCONline 2021 is going strong! To catch the live sessions — or to watch all the videos on demand after GrafanaCONline ends on June 17 — register here. If you didn’t get a chance to watch yesterday’s presentations, here’s what you missed from Day 4 of the conference.

Using Grafana to measure the health of your NGINX instances with NGINX Instance Manager

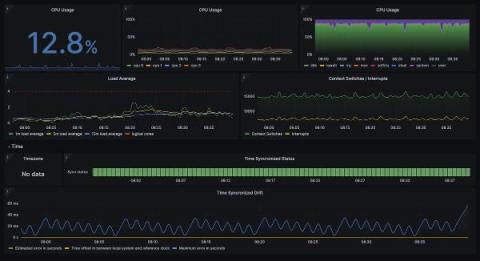
Grafana is an extremely powerful application and infrastructure observability and health platform. The ability to quickly generate operational insights from an amalgamation of sources is compelling. Grafana also benefits from the ability to natively query a Prometheus endpoint to display time-based metrics for display in a dashboard. We’ve built the NGINX Instance Manager tool to measure the health of your NGINX instances with the help of Grafana.

GrafanaCONline 2021 Day 3 recap: Grafana Tempo deep dive, plus how Grafana helps grow e-commerce, scale NFT platforms, and more!

Welcome to week 2 of GrafanaCONline 2021! There are three more days of programming that you can tune into live by registering here. You will also be able to watch all the videos on demand after GrafanaCONline ends on June 17. Here’s what you missed on Day 3 of GrafanaCONline.

The new unified alerting system for Grafana: Everything you need to know

Alerting is the part of the Grafana open source project that has received the most requests for features and improvements. For some time now, the changes have been minimal, but we’ve been listening to the community. With Grafana 8, our investment in alerting is here.

GrafanaCONline Day 2 recap: Grafana 8 deep dive, Prometheus innovation, a billion time series at Robinhood, and more

GrafanaCONline 2021 is off to a great start! Tune in live (for free!) or sign up to get notified about on-demand access to all the session recordings, which will be available after GrafanaCONline ends. If you didn’t get a chance to watch yesterday’s presentations, here’s what you missed on Day 2 of the conference.

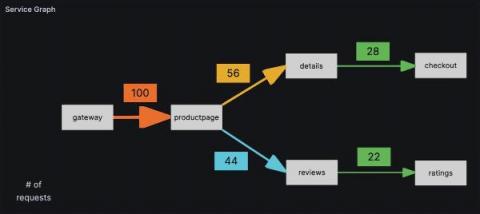
Grafana Tempo is now GA with the release of v1.0

It’s exciting to see a project that you’ve poured so much time into progress at the rate Tempo has. Tempo is not the first piece of software I have shepherded from the very first line of code to a production release, but it is the first large-scale open source project I have led. Working with a community that is able to use and improve your software as a community is a powerful thing.

GrafanaCONline Day 1 recap: Grafana 8, Tempo GA, machine learning, ISS, and more!

GrafanaCONline 2021 is live! Join us over the next two weeks for more than 30 virtual sessions, ranging from demos of the new Grafana 8.0 release and technical deep dives around Grafana, Prometheus, Loki, and Tempo to insider looks at how companies are leveraging Grafana in observability, IoT, science, and business intelligence. GrafanaCONline 2021 runs through June 17.