The latest News and Information on Observabilty for complex systems and related technologies.
As we’ve shown in previous blogs, Elastic® provides a way to ingest and manage telemetry from the Kubernetes cluster and the application running on it. Elastic provides out-of-the-box dashboards to help with tracking metrics, log management and analytics, APM functionality (which also supports native OpenTelemetry), and the ability to analyze everything with AIOps features and machine learning (ML).
There’s a reason everyone dreads debugging, especially in today’s complex cloud systems: it’s at the high stakes nexus of nervous senior management, overworked engineers, neverending rabbit holes, copious buckets of time, and fickle customers.
The Honeycomb design team began work on Lattice in early 2021. Over several months, we worked to clean up and optimize typography, color, spacing, and many other product experience areas. We conducted an extensive audit of all components, documenting design inconsistencies and laying the foundation for a sustainable design system. However, a more extensive evaluation and audit were necessary before updating or developing components.
Enterprises have enough data, in fact, they are overwhelmed with it, but finding the nuggets of value amongst the data ‘noise’ is not all that simple. It is bucket’d, blob’d, and bestrewn across the enterprise infrastructure in clouds, filesystems, and hosts machines. It’s logs, metrics, traces, config files, and more, but as Jimmy Buffett says, “we’ve all got ’em, we all want ’em, but what do we do with ’em”.
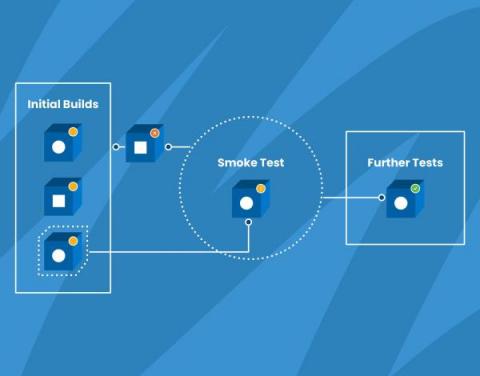
Wikipedia defines smoke testing as “preliminary testing to reveal simple failures severe enough to, for example, reject a prospective software release.” Also known as confidence testing, smoke testing is intended to focus on some critical aspects of the software that are required as a baseline.
Adoption of Azure Functions in cloud-native applications on Microsoft Azure has been increasing exponentially over the last few years. Serverless functions, such as the Azure Functions, provide a high level of abstraction from the underlying infrastructure and orchestration, given these tasks are managed by the cloud provider. Software development teams can then focus on the implementation of business and application logic.
Technology is a fast-moving commodity. Trends, thoughts, techniques, and tools evolve rapidly in the software technology space. This rapid change is particularly felt in the software the engineers in the cloud-native space make use of to build, deploy, and operate their applications. One particular area where we see rapid evolution in the past few years/months is Observability.
At one particular time, a developer would spend a few months building a new feature. Then they’d go through the tedious soul-crushing effort of “integration.” That is, merging their changes into an upstream code repository, which had inevitably changed since they started their work. This task of Integration would often introduce bugs and, in some cases, might even be impossible or irrelevant, leading to months of lost work.
A while ago, we added Metrics to our observability platform so teams could easily see system information right next to their application observability data—no tool or team switching required. So how can teams get the most out of metrics in an observability platform? We’re glad you asked! We had this conversation with experts at Heroku. They’ve successfully blended metrics and observability and understand what is most helpful to know.