Operations | Monitoring | ITSM | DevOps | Cloud

The latest News and Information on Observabilty for complex systems and related technologies.

Intercom: Building a More Resilient Ecosystem Through Observability

Learn how Intercom implemented Honeycomb’s distributed traces to learn about production. Kesha Mykhailov, Product Engineer at Intercom joins Honeycomb Developer Advocate Jessica Kerr, and Account Executive Michael Wilde to discuss how Intercom uses distributed traces to streamline their observability workflows, allowing their product engineers to learn about and from their production to increase Intercom’s resilience. Topics include.

How Much Should Your Observability Stack Cost?

Observability is critical to any software development. It is a term that describes the ability to monitor the performance and health of applications, services, and infrastructure. Observability aims to quickly identify and troubleshoot problems before they become full-blown incidents that can lead to costly downtime. But how much should you invest in an observability stack? Regarding the cost of your observability stack, there is no one-size-fits-all answer.

Reference Architecture Series: Scaling Syslog

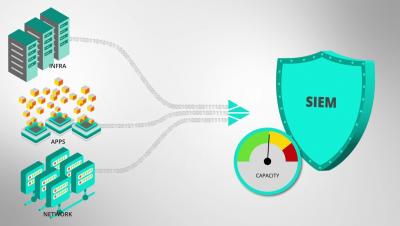
Join Ed Bailey and Ahmed Kira as they go into more detail about the Cribl Stream Reference Architecture, with a focus on scaling syslog. In this live stream discussion, Ed and Ahmed will explain guidelines for how to handle high volume UDP and TCP syslog traffic. They will also share different use cases and talk about the pros and cons for using different approaches to solve this common and often painful challenge.

See How Coveo Engineers Reduced User Latency

Many teams are wasting far too much time and energy searching through massive amounts of log data trying to find answers to user latency issues. Metrics data doesn’t help either as it only tells you that there is a problem, not where to fix it. This is why Coveo turned to observability. Through implementing observability with Honeycomb, Coveo was able to reduce their user latency by 50 percent.

Join Jeli and Honeycomb for an Incident Response and Analysis Discussion

Solutions Engineers Vanessa Huerta Granda and Emily Ruppe from Jeli, along with Honeycomb’s Field CTO Liz Fong-Jones and SRE Fred Hebert discuss some of our more interesting recent incidents and how we use Honeycomb and Jeli together for incident response.

Learn How SumUp Implemented SLOs to Mitigate User Outages and Reduce Customer Churn

Blake Irvin and Matouš Dzivjak from SumUp’s Software Engineering team, Honeycomb Solution Architect Michael Sickles and Account Executive Nathan Leary, discuss how SumUp incorporated observability, specifically, SLOs, to identify and resolve issues before they grew into customer-noticeable problems.

Surface and Confirm Buggy Patterns in Your Logs Without Slow Search

Debugging with logs in distributed systems can be a pain. It’s tough to search raw data looking for a pattern, relating potential causes with other logs, and checking trace and metrics data for more confirmation. Is finding one pattern enough? What if there are other problems? Who knows how many colliding factors are relevant? At Honeycomb, we’re flipping the script on the log search problem. Hear our resident experts, (former Splunk Ninja) Michael Wilde and Andy Dufour, discuss how Honeycomb customers have technically evolved their log analysis process to achieve fast pattern detection, skipping the search grep/search loop entirely.

Introduction to Kubernetes Observability

Cloud has become the de-facto standard for new application development. Kubernetes solves many problems of modern-day cloud infrastructure. It has made microservices-based distributed software systems possible, enabling organizations to provide on-demand scaling. But at the same time, Kubernetes has also increased operational complexity. In simple terms, Kubernetes is a container orchestration tool. Container environments are dynamic and ephemeral.