Operations | Monitoring | ITSM | DevOps | Cloud

The latest News and Information on Observabilty for complex systems and related technologies.

Scale Your Monitoring and Observability With Sensu

Sensu is the complete cloud monitoring solution for observability at scale, designed to give you rich insight and ensure that you know what’s going on everywhere in your system. With true multi-tenancy, an enterprise datastore that keeps pace as you scale, and streaming handlers to process all those events, you can rely on Sensu for cloud, container, and application performance monitoring that provides deep visibility into your entire infrastructure.

Unpacking the Hype: Navigating the Complexities of Advanced Data Analytics in Cybersecurity

The cybersecurity industry is experiencing an explosion of innovative tools designed to tackle complex security challenges. However, the hype surrounding these tools has outpaced their actual capabilities, leading many teams to struggle with their complexity and struggle to extract value from their investment.

A Simplified Guide to Implementing Full-Stack Observability

After the craziness of the last few years, who can blame IT, DevOps, and operations teams for wanting more stability in their personal lives and jobs? Yet the message from the top isn’t in line with this: Gartner reports over 94% of CEOs aim to accelerate pandemic-era digital transformation and are investing 5.1% more into IT budgets. This means threading a delicate balance between stability and scalability.

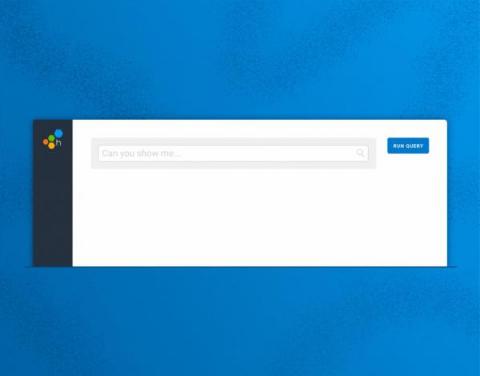
Observability, Meet Natural Language Querying with Query Assistant

Engineers know best. No machine or tool will ever match the context and capacity that engineers have to make judgment calls about what a system should or shouldn’t do. We built Honeycomb to augment human intuition, not replace it. However, translating that intuition has proven challenging. A common pitfall in many observability tools is mandating use of a query language, which seems to result in a dynamic where only a small percentage of power users in an organization know how to use it.

Code Instrumentation in Cloud Native Applications

Cloud native is the de facto standard approach to deploying software applications today. It is optimized for a cloud computing environment, fosters better structuring and management of software deployments. Unfortunately, the cloud native approach also poses additional challenges in code instrumentation that are detrimental to developer productivity.

Kentique - The Fragrance of Observability

What does observability smell like? For ages, humans have relied on sight to observe network, cloud, container, and data center traffic. Kentik is proud to usher in the next step in the evolution of network observability. Welcome to the age of scent! Introducing Kentique, a new fragrance from the creators of Kentik. Whether managing network infrastructure in the server room or entertaining guests at an AWS re:Invent afterparty, you need to smell the part – an aromatic infusion of routers, clouds, clusters, and telemetry dancing in a symphony of observability.

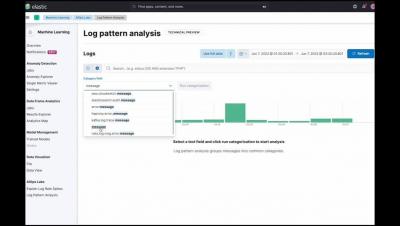
RCA Series: Root Cause Analysis in Observability with Elastic AIOps (2/4)

Root cause analysis empowers you to prevent issues from recurring that were revealed by your monitoring IT systems and online applications including eCommerce sites. See Elastic engineers walk you through applying four AIOps capabilities and accelerate MTTR by automatically categorizing logs, explaining log rate spikes, visually inspecting anomalous components in their context, and correlating slow or failed transactions with potential root causes.

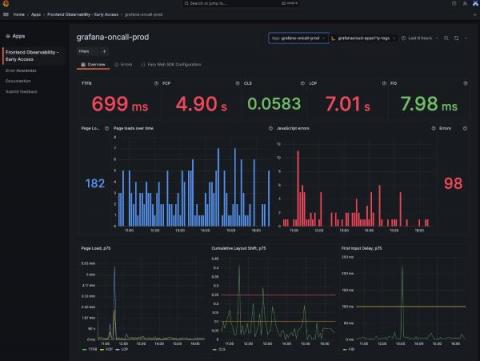
Gain real user monitoring insights with Grafana Cloud Frontend Observability

At ObserabilityCON 2022, we announced a limited private preview program for Grafana Cloud Frontend Observability, our hosted service for real user monitoring. Today we are excited to introduce a public preview program that makes Frontend Observability accessible to all Grafana Cloud users, including those in our generous free-forever tier. Simply look for Frontend under Apps in the left-hand navigation of the Grafana Cloud UI and click through to set up the feature. (Not a Grafana Cloud user?