More than half of organizations prioritize security over user experience
Network visibility demands holistic approach to balance user experience with security.


The latest News and Information on IT Networks and related technologies.
IT Infrastructure Monitoring (ITIM) tools like Progress’s own What’s Up Gold are the backbone of any IT Operations monitoring strategy. However, these tools are primarily focused on general purpose visibility across a wide range of infrastructure and systems with an emphasis on operational availability and performance.
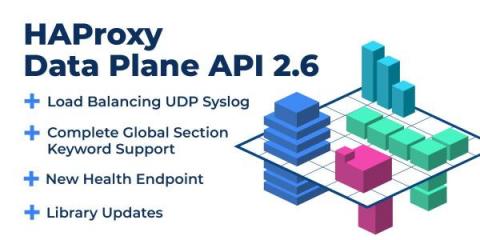
In HAProxy Data Plane API version 2.6, we continued the effort of expanding support for HAProxy configuration keywords, as this has been the priority with this release cycle, and it will be in the next one too to meet our goal of achieving complete feature parity with both the HAProxy configuration and Runtime API. This will enable you to use HAProxy Data Plane API for configuring HAProxy without any gaps in functionality.
Recently we caught up with the Sumo Logic team to discuss network visibility and optimizing application stack views. We took a look at their API and found that it would be easiest to use the HTTP Ingest method to send in our metric data.
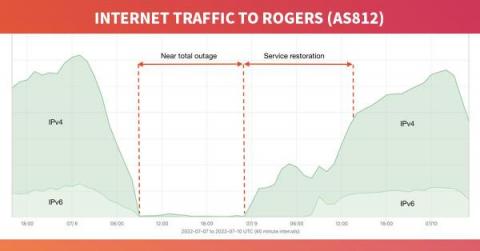
Beginning at 8:44 UTC (4:44am EDT) on July 8, 2022, Canadian telecommunications giant Rogers Communications suffered a catastrophic outage taking down nearly all services for its 11 million customers in what is arguably the largest internet outage in Canadian history. Internet services began to return after 15 hours of downtime and were still being restored throughout the following day.