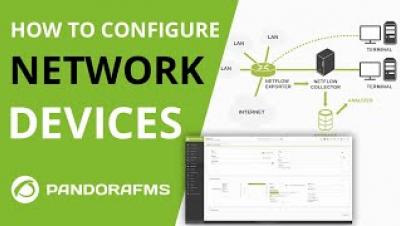
How to configure remote agents (network devices) in Pandora FMS
Do you know how to configure remote agents in Pandora FMS? Discover it in this video where you will know all the steps in detail.


The latest News and Information on Monitoring for Websites, Applications, APIs, Infrastructure, and other technologies.
There's no type of monitoring tool that can get to the heart of a performance problem faster than Application Performance Management (APM). If you're making this decision, you may be choosing between New Relic and Scout. There are cases where New Relic is a better fit, clear cases where Scout fits like a glove, and some murky situations as well. Where do you fall? Below, I'll summarize the factors to consider when choosing your best APM product.
So far, we’ve learnt how to collect data (part 2) and pull it into Azure Log Analytics (part 3), as well as how to actually work with the data using Kusto (part 4). Now it’s time to explore how we can visualize this data, make dashboards, share them with other teams in our organizations and so on. Unfortunately, dashboarding in Azure is not very sophisticated, and neither is it centralized.
Dynamic pricing has become the norm in online retailing. The dynamic pricing method is successful in attracting customer’s attention and also increases profitability for online retailers. It requires you to have a large amount of data in hand like competitors’ pricing, details concerning products and customers, and difference between supply and demand.
If you’re a developer, you know all about APIs. However, if you’re in a non-technical role, you may not have the information you need to make educated decisions about the APIs your company offers and uses. In this article, we will take you through the API basics: what they are, how they work, why they’re important, and what you can do to protect your business’s reliance on API performance and uptime.
Using dashboards in Cloud Monitoring makes it easy for you to track important system metrics. Creating dashboards by hand in the Monitoring UI can be a time-consuming process, especially if you want to use them in multiple different Monitoring Workspaces. With the recent GA announcement for the Cloud Monitoring dashboards API, you now have a way to programmatically create dashboards.
After a closed beta test of 3 months, we’re finally making Uptime Monitoring in iLert generally available. And the best of all, uptime monitoring will be included on all our existing plans at no additional cost.
In this guest article, SRE experts John Arundel and Andy Pearson show you how to connect your Checkly data to Prometheus and Grafana, as part of an integrated observability pipeline.
Top Weekly Reads in IT I&O The OpsRamp Monitor is OpsRamp’s top weekly review of interesting developments and emerging trends in IT operations. In this issue: It’s been a week. Four U.S. presidential contenders dropped out of the race. Coronavirus got worse. Several major tech conferences have been canceled. And the stock market rollercoaster ride continued. Let’s refresh with some good news: your career.