Operations | Monitoring | ITSM | DevOps | Cloud

The latest News and Information on Monitoring for Websites, Applications, APIs, Infrastructure, and other technologies.

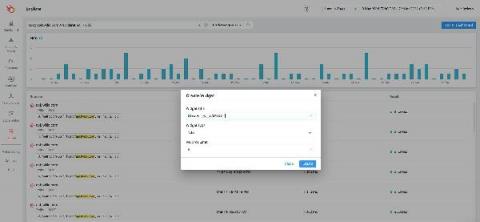
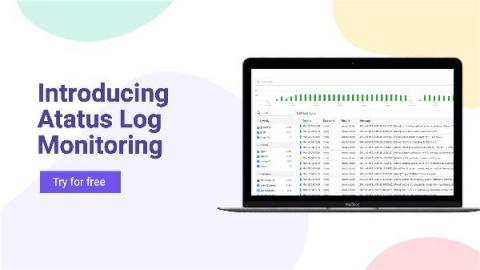
Introducing Atatus Log Monitoring

Log Monitoring is a crucial step in ensuring to know what’s happening in all your servers from a single location. Did you know Log Monitoring tools are implemented by the strategy called “defense-in-depth”? Boom!!! That’s where the log monitoring concept developed, and now we have many log monitoring tools in the market. Issues that users face in the log monitoring tool: We considered all the above points while we designed our tool.
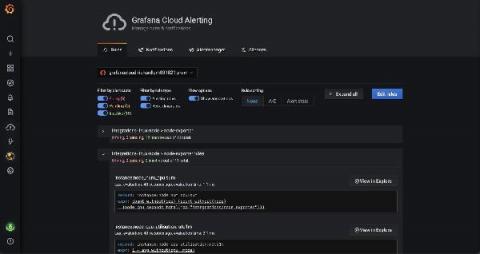
What's new in Grafana Cloud for March 2021: improvements to alerting, synthetic monitoring, and more

As the product manager for Grafana Cloud, I am constantly following the progress of all the new features that our engineering teams are working on, from early ideation to release. We’re always excited to share updates with the community, so you can all try them out and let us know what you think. So each month, I’ll be rounding up the latest Grafana Cloud features and improvements on the blog.

Tutorial | How to Set Up LogDNA Ingestion Source

Centralize your logs from any source in LogDNA so that you can monitor and troubleshoot your systems and applications in a single UI. In this video, I’ll show you how to add an ingestion source. We support multiple ingestion sources, which you can learn about in our documentation portal below. In this video, we’ll show you how to ingest Kubernetes logs using the LogDNA Agent.

Tutorial | How to Custom Parsing with LogDNA

LogDNA automatically parses common log types so that you can easily view and search through them. If you have logs that aren't in a format we automatically parse, you can create a custom parsing template so they'll be parsed as well, allowing you to use them in views, alerts, boards, and graphs. In this video, we will show you how to use Custom Parsing templates for a log that we don't automatically parse, such as one from an internal application.

Tutorial | How to use LogDNA Screens

Use LogDNA Screens to display daily log activity from all of your systems or select systems. Use time-shifted graphs to aggregate data from the previous week to compare activity levels in your current week. Our screens let you create an easy-to-read dashboard containing widgets that convey metrics from your logs. These include graphs, gauges, tables, and time-shifted graphs. In this video, we'll create a screen with widgets that provide different views of your webserver's 404s.

Aggregating Application Logs From EKS on Fargate

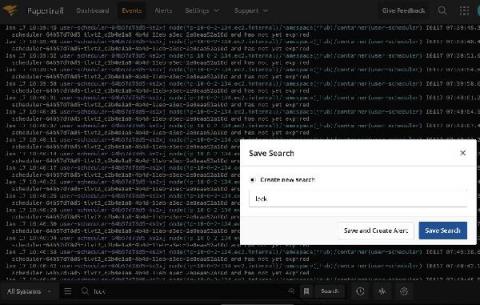
Today we’re going to talk about logging with Kubernetes on AWS using CloudWatch and SolarWinds® Papertrail™. We’ll cover setting up Papertrail, installing and configuring the rKubeLog package, viewing the logs in the Papertrail event viewer, and cross-checking those logs with the ones we see with kubectl. From there, we’ll set up a few different alerts.

What Does Server Monitoring Mean in 2021? A Look at Modern Server Options and How to Monitor Them

A few years ago, monitoring was simple. We had all our servers somewhere in the data center; we just had to install a monitoring tool and gather all the data from every server. Things changed when we started moving to the cloud and then to containers. Today, we often need to monitor a variety of different sources. A “server” can be a physical machine, virtual machine, container, or even a serverless application. Therefore, our approach for monitoring needs to change.

2021 Hybrid Cloud Predictions: CEO Perspective

COVID-19 certainly accelerated some trends. For example, in my view, COVID-19 accelerated the pace and progress of digital transformation by five to 10 years, as companies faced the need to adapt to a post-COVID-19 world, involving permanently the higher adoption of remote work, remote education, and digital touch-points. Technologies requiring less human touch and more digital touch-points will be adopted faster in the aftermath of COVID-19.