
Operations | Monitoring | ITSM | DevOps | Cloud

The latest News and Information on DevOps, CI/CD, Automation and related technologies.

What A Great FinOps Onboarding Looks Like In 2025

I’ve seen firsthand how persona-centric FinOps creates realized savings through synergy. I’m a Certified AWS Solutions Architect, FinOps Engineer, and Customer Success leader who’s had the joy of turning cloud confusion into clarity. I’ve added a customer story below — but hold up, we’ve got onboarding optimizing to do.


Unlock the Power of Self-Service with the ServiceNow Puppet Spoke

Discover how the ServiceNow Puppet Spoke integration streamlines automation, eliminates bottlenecks, and empowers users with self-service capabilities - all without needing expertise in Puppet Enterprise! This demo showcases the integration's potential to transform IT workflows by combining the power of ServiceNow and Puppet.

APM Logs: How to Get Started for Faster Debugging

When application performance monitoring detects a spike in latency or error rates, the immediate challenge is determining the underlying cause. APM logs address this by correlating performance metrics with the specific log events that occurred at the same time. Instead of switching between monitoring dashboards and manually searching through log files, APM log correlation consolidates both views.

Don't Just Monitor SLAs - Validate Them Automatically

Service level agreements (SLAs) are the contractual backbone between customers and technology vendors, outlining expected service availability, performance metrics, and remedies like service credits when service providers fail to meet agreed-upon service levels. This service agreement assures both the technical quality as well as the service quality of the services provided, and underpins the value perspective of the client.

Frontline Reliability: Protecting User Journeys with SLOs with Shery Brauner (Razor, ex-Zalando)

What does it really take to move from firefighting incidents to building reliability at scale? In this episode of Humans of Reliability, Shery Brauner (Razor, ex-Zalando) shares her unique journey from frontend and backend engineering to leading site reliability practices. She explains why protecting the user journey is the key to effective incident management, how SLOs cut through noisy alerts, and why observability must come first.

Discover Infrastructure: Kubernetes & Hosts - Launch Week / Day 03

Stop debugging infrastructure issues across multiple dashboards. See how Last9's Discover Infrastructure monitors K8s pods and traditional hosts together—with resource analysis, pod-level debugging, and AI that correlates app problems to infrastructure root causes. One setup (K8s + host monitoring) → Complete infrastructure visibility that connects to your services and jobs. No more blind spots between application performance and underlying resources.

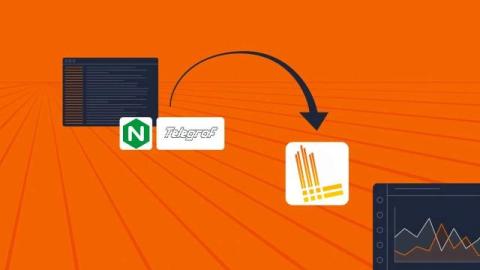
Nginx Logs & Performance Monitoring with Loki and Telegraf | MetricFire

When a web service slows down or errors spike, metrics can tell you what changed (active connections rise, error rate increases), but the root cause can sometimes be found in your logs (which IPs are hammering POST endpoints, 4XX/5XX occurrences). Put the two together and you get the full observability picture. Time-series metric trends to spot incidents, and line-level details to fix them fast.

Your Apps Are Green. Your Infrastructure Is Dying.

Launch Week Day 3: Introducing Discover Infrastructure Your dashboard looks perfect. APIs responding in 80ms, background jobs processing smoothly, error rates at 0.02%. Everything's green. Then production breaks. "Why is checkout so slow?" "The payment service keeps timing out!" You run kubectl get pods and discover payment-service pods restarting every 3 minutes due to OOM kills. Then you check your database host—CPU at 98% because someone forgot the new ML training job runs there too.

A Detailed Guide to Azure Kubernetes Service Monitoring

Azure Kubernetes Service (AKS) continuously generates a high volume of telemetry, ranging from node-level CPU and memory usage to request latencies and error rates within individual pods and services. Without a structured monitoring strategy, this flood of metrics can easily become noise, leaving teams blind to early warning signs. Effective monitoring in AKS is about identifying the right signals, correlating them across layers, and acting before they impact application performance or cluster stability.