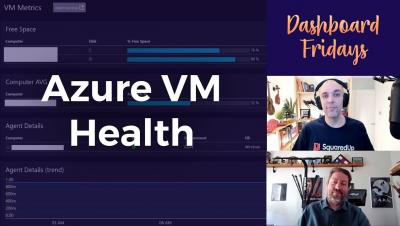
Dashboard Fridays: Azure VM Health Dashboard

Adam is back for our final Dashboard Fridays video of 2021, and is joined by Azure expert and community hero Cameron Fuller of Catapult Systems! The Azure Management Services team at Catapult required a quick way to visualize the key health pieces for their customers, using a visually intuitive dashboard. In this bitesize video, Cameron will showcase this sample Azure VM Health dashboard focused on free disk space, heartbeat and CPU utilization. Tune in to learn how it was made, the challenges it solves, and how you can easily get your hands on it.
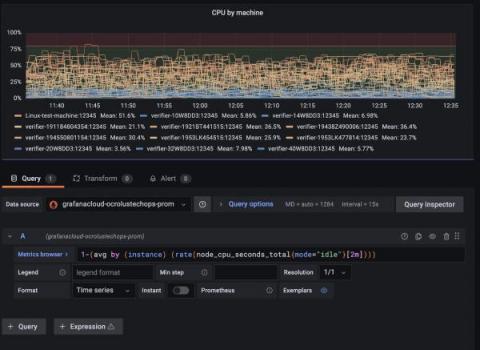

Monitoring remote user workstations with Prometheus, Ansible, and Grafana Cloud

Monitoring is usually associated with servers and applications, but the fintech automation platform Ocrolus recently needed to set up monitoring for a different purpose: to gain meaningful data and insights about nearly 1,000 remote user workstations.

LogicMonitor launches Santa Tracker Dashboard to monitor annual Christmas flight

A pillar of the December holiday season, the Elves at Santa’s Workshop work tirelessly year-round to provide a quality Christmas experience for children around the world who have made it to the Nice list. To ensure all children on the Nice list receive their Christmas packages in a timely manner, the IT team at Santa’s Workshop turned to LogicMonitor to monitor Santa’s annual journey around the globe in real-time.

Azure Thames Valley: Azure CosmosDB as a Knowledge Graph (in SquaredUp's Cloud product)

In this session, Richard Jones, SquaredUp CTO, shares how SquaredUp's new Cloud product utilises Azure CosmosDB as a graph database, to provide an explorable and searchable knowledge graph of all your applications, services, and resources spanning all your tools and platforms.

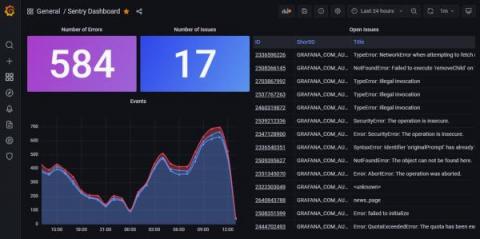
Introducing the Sentry data source plugin for Grafana

We’re thrilled to announce the addition of the Sentry data source plugin to Grafana. Grafana Labs worked in partnership with Sentry, the code observability platform, to help development teams see the issues that matter and solve them faster — across their entire tech stack — so they can remove silos and ship with confidence.

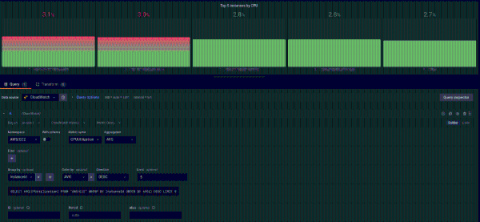
Identify operational issues quickly by using Grafana and Amazon CloudWatch Metrics Insights

Amazon CloudWatch has recently launched Metrics Insights (Preview) — a fast, flexible, SQL-based query engine that enables you to identify trends and patterns across millions of operational metrics in real-time. With Metrics Insights, you can easily query and analyze your metrics to gain better visibility into the health and performance of your infrastructure and large scale applications.

Get Started with the Public Beta for Unified Dashboards

During Logz.io’s ScaleUp 2021 user conference, we announced that Unified Dashboards were coming to you soon. And now it’s finally here for anyone to try during the Public Beta. Unified Dashboards will allow Logz.io customers to analyze and filter their logs, metrics, and traces side-by-side on a single monitoring dashboard. Check out our recent blog to learn about why we built Unified Dashboards and the value they bring to customers.

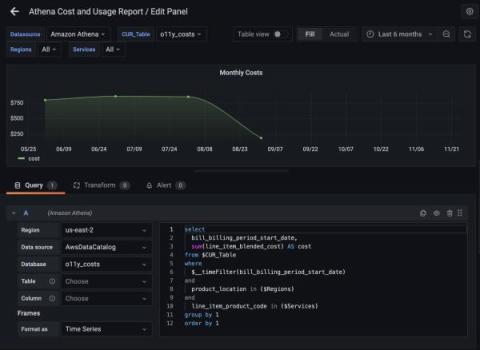
Query and analyze Amazon S3 data with the new Amazon Athena plugin for Grafana

In collaboration with the AWS team, we have recently released the new Athena data source plugin for Grafana. Athena is an interactive serverless service that makes it easy to analyze data in Amazon S3 using standard SQL. Athena supports a wide variety of data formats including CSV, JSON, ORC, Arvo, and Parquet. Athena also integrates with AWS Glue Data Catalog, which allows you to create tables and query data based on a central metadata store of many AWS services, such as CloudFront, ELB, and more.