Product Growth KPIs Dashboard for Enterprises

There can be as many as 64 important business metrics for your company to track (according to nTask). That can sound daunting. But if your organization doesn’t have the capacity to track all of them, it should at least track the most important ones according to its business model, stage and focus areas. For example, key product metrics not only provide information to product managers, but also other relevant stakeholders across the organization.

How Kambi migrated from an in-house Graphite solution to Grafana Cloud

When you’re a sports betting technology company and you realize your in-house, on-prem Graphite solution for monitoring metrics is no longer a sure-thing, what do you do? That was the dilemma at Kambi, a quickly growing business – with a passion for using open source technology – that has about 500 different micro services in production and around 200,000 incoming metrics messages per second.

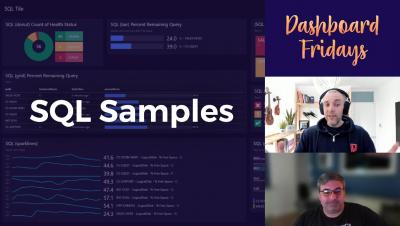
Dashboard Fridays: Example SQL Samples Dashboard

Join SquaredUp's Adam Kinniburgh and fellow virtualisation expert Shawn Williams as they showcase this SQL Sample dashboard. This dashboard was designed to demonstrate how the same base SQL query could be used with each of SquaredUp’s visualizations. Each SQL visualization slightly modifies how the data is presented to target user requirements. Tune in to learn how it was made, the challenges it solves, and Shawn's top tips for building it yourself.

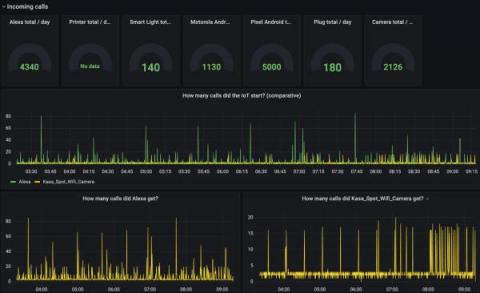
Visualizing IoT security metrics with Grafana at Network to Code

As the number of connected gadgets in our homes, offices, and industrial networks continues to grow exponentially, keeping IoT devices secure has become a vital part of our everyday lives. However, our webcams, printers, and smart plugs often lack security features due to their fast time to market, making them particularly vulnerable to attack. And because security metrics themselves can be tricky to assess, tracking IoT device security is increasingly a challenge.

How Snyk, TripAdvisor, and Citibank use Grafana to effectively scale observability

It’s one thing to set up an observability strategy. But what’s it like to introduce and scale observability effectively across an organization? In a wide-ranging conversation at ObservabilityCON 2021, three technical pros from Snyk, TripAdvisor, and Citibank joined Grafana Labs VP Global Solutions Engineering Steve Mayzak and — with more than 75 years experience between them — they shared the triumphs and turbulence in their respective observability journeys.

A 3-step guide to troubleshooting and visualizing Kubernetes with Grafana Cloud

Back in May, we announced the Kubernetes integration to help users easily monitor and alert on core Kubernetes cluster metrics using the Grafana Agent, our lightweight observability data collector optimized for sending metric, log, and trace data to Grafana Cloud. Since then, we’ve made some improvements to help our customers go even further.

Dashboard Fridays: Sample Symantec Endpoint Protection (SEP) Dashboard

Join SquaredUp's Adam Kinniburgh and SCOM community hero Ruben Zimmermann as they showcase this example SEP Dashboard. Giving an overview of the status of the various endpoint protection systems, this dashboard is used by the IT team to keep on top of device security, and by the service desk to escalate appropriately.

WFA: Visible - Digital Experience Index (DXI) Dashboard

If you’re not sure where to start when prioritizing investments that will have the greatest impact on user experience, this dashboard is for you! Teneo’s WFA: Visible DXI Dashboard allows you to be 5 times faster at prioritizing objectives, identifying what to improve, and reporting on improvement. #TeneoGrp