Dashboards

Gartner IOCS replay: Achieving unified observability with data mesh

The single pane of glass is perhaps the most enduring and elusive goal of enterprise IT operations teams. When we polled our customers a couple of years ago, out of 184 respondents, 99% of them rated it as important to their business – with 64% indicating “extremely important”. The shared dream is to have: But unfortunately, the single pane of glass has become a bit of myth.

Kibana vs Grafana: Battle Of the Dashboards

Every day, we generate tons of data, so much so that we cannot analyze them manually anymore. Visualization is a process by which the generated data will be broken down into smaller packages. Visualization extensively relies on observability and the triumvirate of Logs, Metrics and Traces. When it comes to visualizations and dashboards, Kibana and Grafana are two prominent names in the market. What makes them stand apart from their peers is their ability to conceive top-notch analytics charts.

How to use flow mode for Grafana Agent with Matt Durham (Grafana Office Hours #21)

Senior Software Engineer Matt Durham shows us how to use flow mode for Grafana Agent. Flow mode is a new and better way to install and configure Grafana Agent than the older "static mode". Among other things, flow mode's modularity makes it easier to build more complex workflows like traditional data pipelines and allows for more use cases than collecting and processing telemetry.

How to measure engineering team health

At SquaredUp, we have been debating how the senior leadership team can monitor the ‘health’ of our engineering teams. To do this, we decided to create a dashboard that could represent this for a team – but first, we needed to figure out what to measure. Our goal was to better understand our teams to inform which actions to take to support them and make them a happier and more productive bunch.

Virtual Customer Workshop 2023

Last week, we were very excited to host our first ever SquaredUp Virtual Customer Workshop! We’d received so much positive feedback on the intimate in-person workshop we ran in the UK last month that we wanted to extend the invitation worldwide – by recreating the experience virtually. Using the digital conferencing app Gather Town, we were pleased to welcome 23 SquaredUp customers from 12 countries to our virtual “SquaredUp Town”.

Grafana Dashboard Tutorial: How to Get Started

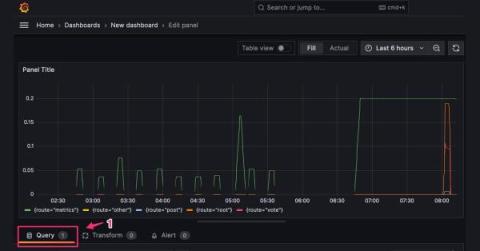
Grafana is an open-source web application for visualizing data. You can query your data, create visuals, and receive alerts to better understand what you have. Some people think of Grafana as a Kubernetes-only tool, but in reality, it’s simply a data visualization tool that became popular within the Kubernetes ecosystem, especially when combined with Prometheus. In this post, I’ll focus on a very specific part of Grafana: the dashboards.

New in Grafana roles: Manage user permissions better with 'No basic role'

Since we introduced role-based access control (RBAC) in Grafana 9.0, users — and later, service accounts — have been required to have an assigned role that includes a basic set of permissions. This sometimes led organizations to create users and service accounts that had more permissions than necessary. As a result, Grafana administrators had to make additional adjustments to users’ permissions on a case-by-case basis.

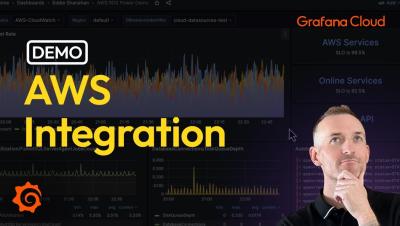
Effortlessly monitor AWS services in Grafana Cloud

Including AWS service metrics and logs into a single pane of glass helps engineers get holistic visibility into their infrastructure. Analyze 60+ AWS services across your individual accounts and regions without the toil of configuring data and building dashboards from scratch. Learn how to: Sign up for a free Grafana Cloud account today and unlock the potential of distributed tracing in your performance testing workflow.

Building scalable OSS observability with Mimir, Loki, Tempo, and Pyroscope | ObservabilityCON 2023

In this video, we cover the latest and greatest news about the scalability and performance of the open source telemetry backends that make up the Grafana LGTM Stack: Grafana Mimir for Prometheus metrics, Grafana Loki for logs, and Grafana Tempo for traces.

Quick start guide to Unified Analytics dashboards

When it comes to observability, we’ve found that most organizations have ~20 tools installed in their IT environments. With so many tools, it’s difficult for IT leaders to gain insight into how their tools are performing and determine how much value ITOps is bringing to the organization.