Dashboards

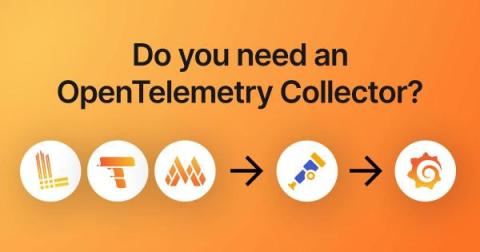
Do you need an OpenTelemetry Collector?

When you use OpenTelemetry SDKs to collect logs, metrics, and traces from infrastructure or an application, you’ll find many references to people using Grafana Agent and OpenTelemetry Collector. They start with an application or infrastructure that sends telemetry, and that data is sent to a collector, which then sends it to a backend like Grafana that may perform many functions, including visualization.

The Leading Jaeger Dashboard Examples

Unlocking the full potential of observability and tracing in modern software ecosystems has become imperative for businesses striving to deliver improved reliability and user experience. In this comprehensive roundup, we will dive into the world of Jaeger-incorporated observability and tracing dashboards, offering a curated selection of the best use cases that empower DevOps teams, engineers, and developers to gain unparalleled insights into the inner workings of their applications.

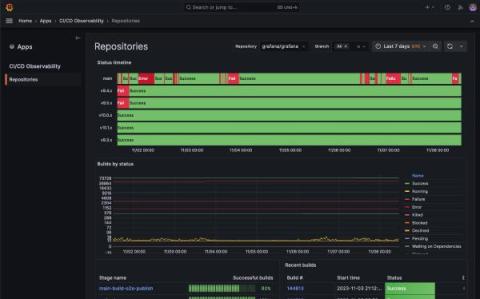
What is CI/CD observability, and how are we paving the way for more observable pipelines?

Observability isn’t just about watching for errors or monitoring for basic health signals. Instead, it goes deeper so you can understand the “why” behind the behaviors within your system. CI/CD observability plays a key part in that. It’s about gaining an in-depth view of the entire pipeline of your continuous integration and deployment systems — looking at every code check-in, every test, every build, and every deployment.

Application Observability and Beyla Demo | ObservabilityCON 2023

In cloud native environments, finding and resolving issues across services and between application and infrastructure dependencies can be challenging. In this recording, we provide demos on Grafana Cloud’s latest capabilities for correlating application and infrastructure observability: Application Observability and Beyla — both generally available. You will hear how Grafana unifies and contextualizes service relationships and application and infrastructure dependencies to help you resolve problems faster.

User-centered observability: load testing, real user monitoring & synthetics | ObservabilityCON 2023

Understanding your end users’ experience with your applications and services is critical, and there are a variety of tools to help. But there are also a number of different use cases: During development or in production? Simulate user behavior or monitor real user behavior? What should you use and when? This recorded session explores when and how to apply load testing, synthetic monitoring, and real user monitoring to gain insights into the end user experience of your critical applications.

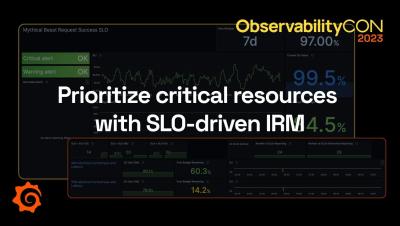
Grafana SLO Demo: Prioritize critical resources with SLO-driven IRM | ObservabilityCON 2023

A majority of respondents in our Observability Survey said they were using SLOs or moving in that direction. For good reason: By highlighting the most critical error budget burndown, service level objectives (SLOs) can help you prioritize performance issues based on business impact. In this recording, Josh Abreu Mesa and Reem Tariq walk through how Grafana Cloud’s integrated SLO and Incident Response Management (IRM) capabilities can help you identify the most important issues and resolve them quickly.

How Pipedrive switched its observability stack to OpenTelemetry & LGTM | ObservabilityCON 2023

The cloud-based CRM company Pipedrive has been relentlessly modernising its observability stack, first adopting Grafana visualisation and Grafana Mimir for Prometheus metrics, then recently completed a migration of its distributed tracing from a third-party SaaS provider to OpenTelemetry and Grafana Tempo, and its logging stack from Graylog to Grafana Loki. Along the way, the team developed its own in-house library to include OpenTelemetry in its roughly 750 microservices.

Manage metrics & logging costs with Grafana Cloud + Log Volume Explorer demo | ObservabilityCON

Are your SRE and platform teams under pressure to ingest fewer metrics and logs in the name of cost savings? Reducing costs does not have to mean reduced observability. This recording walks through the cost management features in Grafana Cloud that allow you to analyze, attribute, monitor, and optimize your metrics and logs usage – and lower costs – without compromising your observability strategy.

How the LGTM Stack changed the observability culture at Wise Payments

The observability team at Wise Payments – Europe’s leader in cross-border money transfers – had long provided the company’s developers access to a multitude of tools. But as costs and complexity increased, Ibukun Itimi, Engineering Lead for Observability and Andrew Brown, Reliability Squad Lead, saw an opportunity to change not only the tools they were using, but also the observability culture.

Best practices to scale and modernize your observability strategy

ObservabilityCON 2023 took place in London this week, showcasing all the latest and greatest trends in open source observability. Following the opening keynote, the event featured a range of breakout sessions — led by both Grafana Labs experts and members of the Grafana OSS community — that explored observability best practices and lessons learned.