Operations | Monitoring | ITSM | DevOps | Cloud
The latest News and Information on Containers, Kubernetes, Docker and related technologies.
DevOps.com - Helm 3: Navigating to Distant Shores
What's new in Kubernetes 1.17?
Kubernetes 1.17 is about to be released! This short-cycle release is focused on small improvements and house cleaning. There are implementation optimizations all over the place, new features like the promising topology aware routing, and improvements to the dual-stack support. Here is the list of what’s new in Kubernetes 1.17.
Vagrant vs. Docker: Which Is Better for Software Development?
The last fifteen years have seen huge increases in developer productivity for several reasons, including the arrival of open source into the mainstream and the ability to better emulate target environments. In addition, the process of resetting a development environment back to the last known stable version has been vastly improved by Vagrant and then Docker.
5 lessons from the Lighthouse Roadshow in 2019
Having completed a series of twelve Lighthouse Roadshow events across Europe and North America over the past six months, I’ve had time to reflect on what I’ve learnt about the rapid growth of the Kubernetes ecosystem, the importance of community and my personal development.
Kubernetes Observability with Logs and Metrics in Logz.io
Yesterday, we announced the beta release of Logz.io Infrastructure Monitoring — our Grafana-based monitoring solution, and the planned release of a Jaeger-based tracing solution. These additions to our platform complement our ELK-based Log Management product, together constituting what is the world’s only open source-based observability platform for monitoring, troubleshooting and securing distributed cloud workloads.
Monitor Amazon EKS on AWS Fargate with Datadog
AWS Fargate has steadily gained traction in Amazon Elastic Container Service (ECS) environments because it allows users to run containerized applications without thinking about their underlying infrastructure. Today, AWS announced that support for Amazon Elastic Kubernetes Service (EKS) on AWS Fargate is now generally available, giving Amazon EKS users the option to seamlessly manage their infrastructure with AWS Fargate instead of manually provisioning EC2 worker nodes.
[KubeCon Recap] Cloud Native Architecture: Monoliths or Microservices?
Microservices have been gaining popularity since they were introduced in 2015. But they come with challenges for both developers and users because of the intricate configuration and deployment which often leave developers longing for the simplicity of monolithic applications.
Hands On With Rio Beta at KubeCon NA 2019
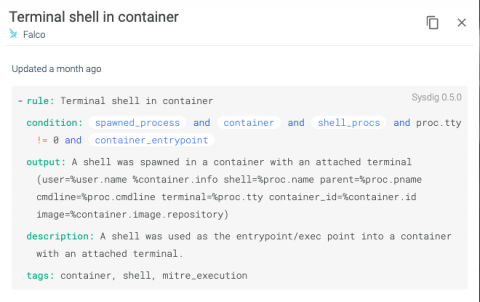
Modern compliance with Sysdig Secure DevOps Platform
Authorization to Operate (ATO) in a day and on-going authorization are compliance nirvana. The ATO is the authorizing official’s statement that they accept the risk associated with the system running in production environments using live business data. The idea that all of the information necessary to make a risk decision is at hand and can be consumed by decision makers is what every compliance program is trying to achieve.


