An easier way to manage your observability collectors | Grafana
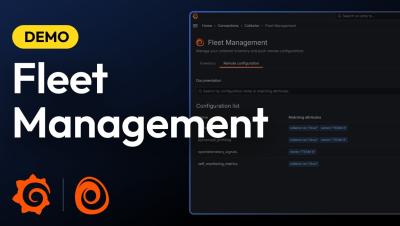
Managing observability collectors at scale is often overwhelming, but it doesn’t have to be. Grafana Fleet Management offers a better way to monitor, configure, and control your collectors—all from a centralized platform. With remote configuration and detailed health insights, you can quickly resolve issues, save time, and reduce manual effort.