Operations | Monitoring | ITSM | DevOps | Cloud

Grafana

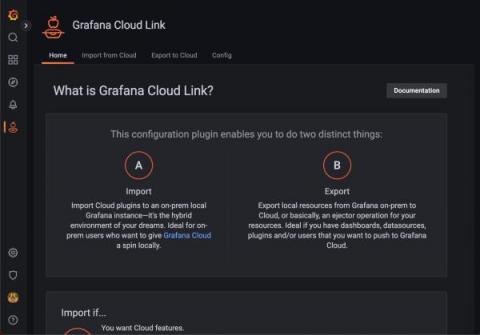
Announcing Grafana Cloud Link, a gateway from any local Grafana instance to Grafana Cloud

If you’ve had a local Grafana instance for any length of time, it’s likely dialed in just how you like it, and that’s a good thing. If you are working within Grafana Cloud, by contrast, you are using a heavily opinionated experience that our teams are building, managing, and provisioning. As a result, we serve up solutions that users can work with out of the box and can use to build their stack.

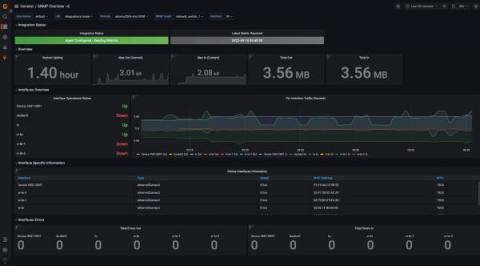
Set up instant SNMP monitoring with the new SNMP integration in Grafana Cloud

Simple Network Management Protocol (SNMP) is an internet protocol that is used to collect information about network devices and manage them. Most of the modern devices connected to a network support SNMP, such as routers, switches, servers, printers, and more. There are three different versions of SNMP (v1, v2, and v3). It most commonly operates on UDP ports 161 and 162. The most common versions being used are v1 and v2. The data can be collected from a network device through SNMP via polling.

Inside the migration from Consul to memberlist at Grafana Labs

At Grafana Labs we run a lot of distributed databases. These distributed databases all make use of a hash ring in order to evenly distribute workloads across replicas of certain components. For a more detailed description of the architecture of our projects, check out our Mimir architecture docs.

How to build machine learning models faster with Grafana

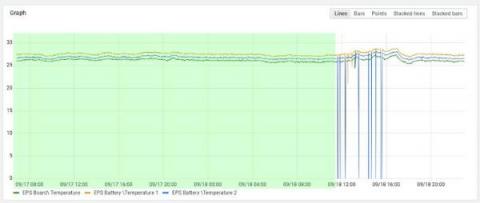
Armin Müller is the co-founder of ScopeSET. ScopeSET specializes in R&D work to build and integrate tools in the model-based systems engineering domain, with a track record of more than 15 years of delivering innovative solutions for ESA and the aerospace industry. Training machine learning models takes a lot of time, so we’re always looking for ways to accelerate the process at ScopeSET. We use open source components to build research and development tools for technical companies.

Troubleshoot in less than 60 seconds with Grafana: Inside NOS's observability stack

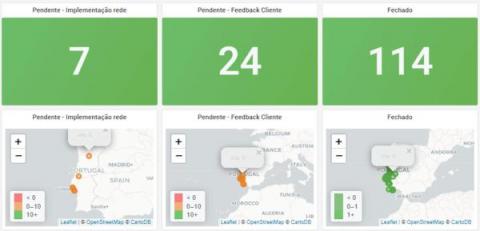
It may seem like ancient history, but there was a time when telecommunications companies only had to worry about connecting customers over landlines. Today, their businesses depend on vast cellular networks to not only provide strong wireless phone coverage in countless locations, but also handle the demands of tablets, computers, and machine-to-machine communications.

How to convert a mini-arcade machine into a Grafana dashboard display with Raspberry Pi

When COVID-19 hit, Yonatan Mevorach faced an unexpected challenge, which required an unexpected solution. The Infrastructure Team Lead at Wix, the popular website building platform, was accustomed to looking at multiple monitors on the walls of the software company’s offices in Tel Aviv, Israel. These monitors cycled through Grafana dashboards to help the team keep tabs on Wix’s many services.

Grafana alerts as code: Get started with Terraform and Grafana Alerting

Alerting infrastructure is often complex, with many pieces of the pipeline that often live in different places. Scaling this across many teams and organizations is an especially challenging task. As organizations grow in size, the observability component tends to grow along with it. For example, you may have many components, each of which needs a different set of alerts. You may have several teams, each with a different channel where notifications should be delivered.

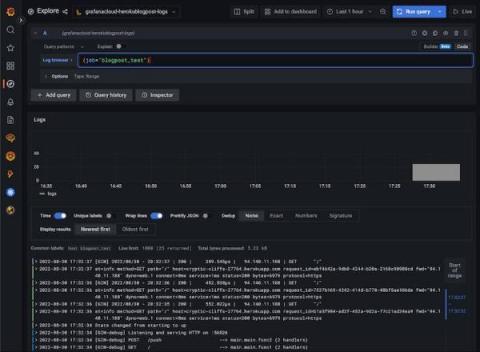
How to easily configure Grafana Loki and Promtail to receive logs from Heroku

Heroku is a cloud provider well known for its simplicity and its support out of the box for multiple programming languages. When thinking about consuming logs from applications hosted in Heroku, Grafana Loki is a great choice. But in the past, shipping logs from Heroku to any Loki instance required ad-hoc scripts to fiddle with Heroku’s logs format and send them. This can be a time-consuming experience.

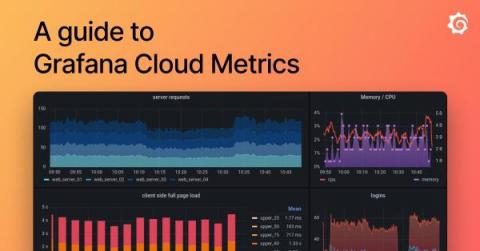
Grafana Cloud Metrics: A guide to what metrics to monitor and best practices

Metrics are the cornerstone of an observable system – they tell you a system’s measured outputs, granting visibility into what your customers are experiencing and when there’s a problem. However, not all methods for recording and saving metrics from a system’s output are alike. The best method for shipping your system’s metrics to Grafana Cloud depends on many factors, varying from the source of your metrics data to your familiarity with observability tools.