Operations | Monitoring | ITSM | DevOps | Cloud

Grafana

Using Grafana and machine learning to analyze microscopy images: Inside Theia Scientific's work

At GrafanaCONline 2022, Theia Scientific President, Managing Member, and Lead Developer Chris Field and Volkov Labs founder and CEO Mikhail Volkov — a Grafana expert — delivered a presentation about using Grafana and machine learning for real-time microscopy image analysis. Real-time microscopy image analysis involves capturing images on a microscope using a digital device such as a PC, iPad, or camera.

Grafana usage insights: How to track who is sending what metrics to your stack in Grafana Cloud

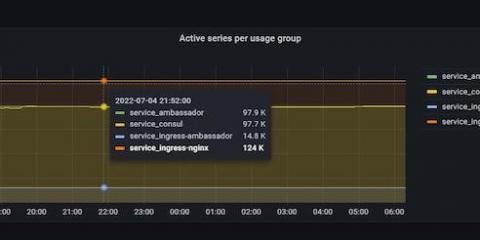
We are happy to announce the release of the Grafana usage groups feature in Grafana Cloud. This new feature — which is available in the Grafana Cloud Advanced plan — helps centralized observability teams and administrators track and attribute metrics usage back to groups that exist within a single shared Grafana stack. Ultimately, Grafana usage groups can help with governance and cost control.

The updated Docker integration in Grafana Cloud now supports logs and metrics

More than 17 million developers use Docker to build, ship, and run applications separate from their infrastructure in order to deliver software faster and more efficiently. With the rising popularity of containerized applications, however, it has become increasingly more complex and difficult to observe and monitor applications running across multiple containers.

Video: How to get started with MongoDB and Grafana

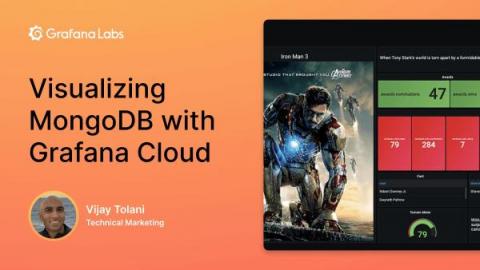
MongoDB is one of the most popular NoSQL databases in the world, used by millions of developers to store application metrics from e-commerce transactions to user logins. The MongoDB Enterprise plugin for Grafana — which is available for users with a Grafana Cloud account or with a Grafana Enterprise license — unlocks all of the data stored in MongoDB as well as diagnostic metrics for monitoring MongoDB itself for visualization, exploration, and alerting.

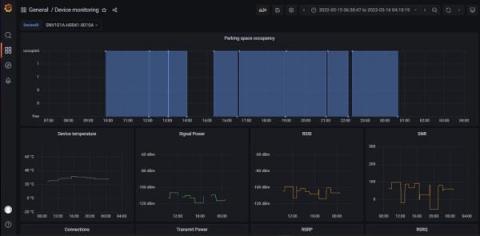
Monitoring smart city IoT devices with Grafana and Grafana Loki: Inside the Fuelics observability stack

For smart cities of the future, monitoring infrastructure metrics like fuel and water levels is vital to optimizing operations. Fuelics PC designs and deploys battery-operated narrowband IoT (NB-IoT) sensors that monitor fuel, water, waste, and even parking capacity at the edge, then transmit that data to the cloud for easy viewing and monitoring.

How to deploy Grafana Enterprise Metrics on Red Hat OpenShift

Here at Grafana Labs, we’re always looking for ways to provide our customers with a choice of platforms where they can run Grafana Enterprise Metrics (GEM). As part of that mission, we’re pleased to announce that we’ve added Red Hat OpenShift 4.x support to GEM. GEM, as you may know, is a leading enterprise metrics solution.

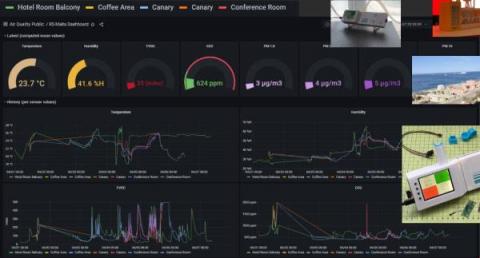
How activist engineers use Grafana Cloud to improve global air quality

With climate change and other environmental factors causing pollution rates and ground-level Ozone levels to climb, poor air quality is an increasingly growing global problem. In fact, fossil air pollution is responsible for 1 out of 5 deaths worldwide, according to a 2021 study conducted by Harvard University.

Grafana Alerting video: How to create alerts in Grafana 9

With the Grafana 9.0 release, we rolled out the new and improved Grafana Alerting experience, which is now the default alerting system across all of our products. Along with introducing significant improvements to Grafana Alerting based on community feedback and more robust alerting documentation to guide our users, we also created easy-to-follow video tutorials to help you get started with creating alerts.

How Grafana Mimir helped Pipedrive overcome Prometheus scalability limits

Karl-Martin Karlson has been working on Pipedrive’s observability team for more than four years, implementing and supporting several observability platforms such as Grafana, Prometheus, Graylog, and New Relic. In sales, as in life, you can’t control your results — but you can control your actions. With that in mind, a team of sales professionals set out in 2010 to build a customer relationship management (CRM) tool that helps users visualize their sales processes and get more done.