Delivering Fearless Updates with JFrog Distribution
Join this webinar to learn how JFrog Distribution tightly integrates with your CI/CD pipeline to allow you to deliver releases with confidence.


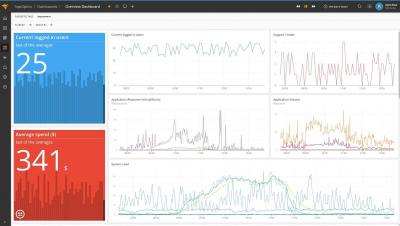
Running your software on dynamic infrastructure means that your monitoring platform needs to change dynamically. Variables let you reuse a single dashboard for all your services. Select the service you want to inspect from a drop-down menu, and watch panels update to only show you metrics from that service. Grafana lets you create dynamic dashboards using template variables. Any variables in your queries interpolate the current value of the variable before the query is sent to the database.
Have you ever lost power to a server? Did it ever reboot on its own? Wouldn’t it be nice to prevent power outage to IT devices? If this is something you’ve experienced in the past, there are ways to simplify power monitoring and avoid some of the outages that can be caused by power issues. This article will focus on using power consumption data from a rack power distribution unit (rPDU) and how to simplify the process.