Operations | Monitoring | ITSM | DevOps | Cloud

Blog

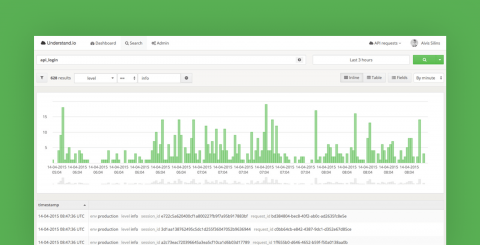
Understand.io – Online Event and Log Management

Applications logs are a critical factor in helping ensure that your online applications are running at their best. By using Understand.io you can get deep visibility into your applications in real-time, helping you to easily track down error messages, application requests, customer problems, and much more.

Server & Application Monitoring Pricing Comparison: Instrumental, New Relic, Datadog, Librato, and SignalFx

Confused about the price of an application and server monitoring tool? So were we! Every tool is priced differently and there are a lot of nuances. We’ll walk you through important terminology differences, the pros and cons of different plans, and then discuss the pricing details for Librato, New Relic, SignalFX, Datadog, and of course, Instrumental.

Node.js Application Performance Monitoring

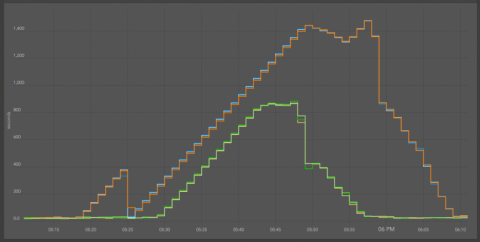
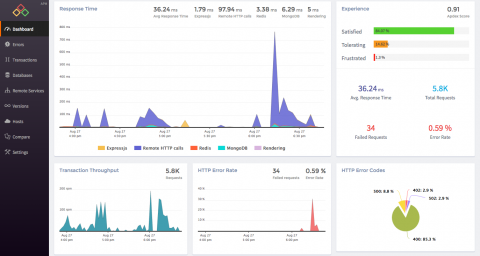
Atatus is a comprehensive application performance management (APM) suite for Node.js applications. Atatus Node.js APM gives you the deeper visibility into the every web transactions happened in your Node.js apps. With Atatus, you can identify the slowest web transactions and see where your web requests are spending time whether it is in the database, remote services or middlewares. Atatus makes Node.js monitoring simpler and easier.

Using Træfik for internal tools at Bleemeo

At Bleemeo, as many geeks, we use a couple of tools on a day to day basis. Most of those tools are small Open Source web applications and, to be trendy, we deploy those tools with Docker. In the past, we used to create a virtual machine per service, deploy the tool and configure web server on each machine. Moreover if you are using https, you need to deploy certificates and private keys on each server.