Operations | Monitoring | ITSM | DevOps | Cloud

Dashboards

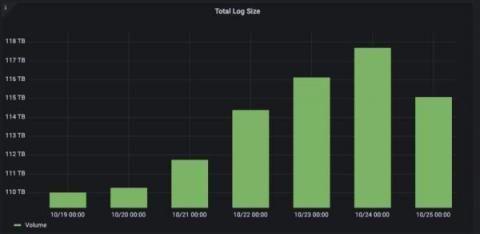
4 billion logs, 120 TB of data: How Just Eat Takeaway.com uses Grafana Cloud to scale

In 2017, Just Eat Takeaway.com (JET) was transitioning from a scrappy startup to a surging scaleup. With a global customer base and workforce, the food delivery marketplace’s front line teams needed to scale the real-time monitoring of the platform. Their initial efforts looked like “NASA’s mission control with Grafana dashboards,” said Senior Technology Manager Alex Murray.

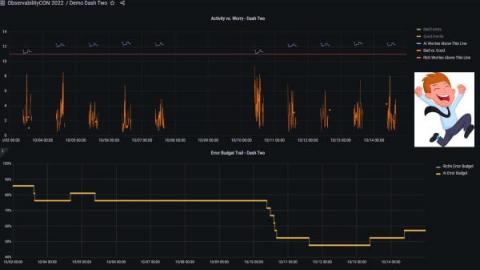
Phantom Metrics: Why Your Monitoring Dashboard May Be Lying to You

Whether you’re a DevOps, SRE, or just a data driven individual, you’re probably addicted to dashboards and metrics. We look at our metrics to see how our system is doing, whether on the infrastructure, the application or the business level. We trust our metrics to show us the status of our system and where it misbehaves. But do our metrics show us what really happened? You’d be surprised how often it’s not the case.

How JPMorgan Chase uses Grafana and AI to monitor SLOs, SLIs, and more

For the team at JPMorgan Chase, the daily stakes of having a stable system are high. “We are in the business of making sure that trades are executed, and systems are stable and up and running for a positive client experience,” said Askari Imam, VP, Asset Wealth Management (Product and Integration Delivery).

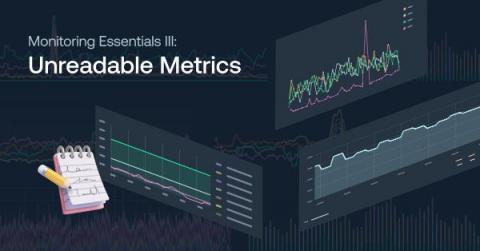
Unreadable Metrics: Why You Can't Find Anything in Your Monitoring Dashboards

Dashboards are powerful tools for monitoring and troubleshooting your system. Too often, however, we run into an incident, jump to the dashboard, just to find ourselves drowning in endless data and unable to find what we need. This could be caused not just by the data overload, but also due to seeing too many or too few colors, inconsistent conventions or the lack of visual cues.

Grafana dashboards in 2022: Memorable use cases of the year

One of our favorite things at Grafana Labs is seeing Grafana dashboards in action. Over the past year, members of the Grafana community — from inside and outside of the company — shared the unique ways they have used dashboards to monitor a wide range of projects including an elderly parent’s home, a Tesla, and a python named Pretzel. Let’s take a look back at some of the eye-catching and informative results.

Grafana Cloud 2022: Year in review

With every new update and feature we introduced to our open source LGTM stack this year, we have also enhanced Grafana Cloud, our hosted offering that is powered by Grafana Loki for logs, Grafana for visualization, Grafana Tempo for traces, and Grafana Mimir for metrics. With Grafana Cloud, “we have curated the open source experience into an easy-to-use, opinionated, and integrated platform,” Grafana Labs VP of Technology Tom Wilkie said in the ObservabilityCON 2022 keynote.

Open source at Grafana Labs in 2022: Year in review

At Grafana Labs, we’re all about open source, and this year we took it to a whole new level. Many of you are familiar with the acronym “LGTM,” which is shorthand for “Looks good to me” and commonly used in code reviews. At Grafana Labs, LGTM has also been a guiding rubric in developing our observability stack.

Dashboard Fridays: Sample Google Kubernetes Engine Dashboard

This SquaredUp dashboard shows key metrics from any GKE (Google Kubernetes Engine) clusters and node groups, including utilization of resources and health status. Tune in to learn how it was made, the challenges it solves, and our top tips for building it yourself.