Grafana Drilldown apps: the improved queryless experience formerly known as the Explore apps
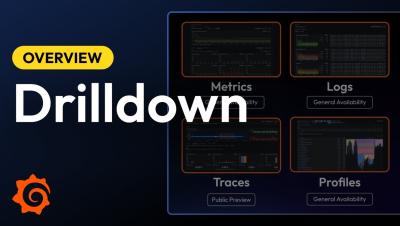
When we introduced the Explore apps suite for metrics, logs, traces, and profiles last year at ObservabilityCON 2024, our goal was simple: offer a queryless, point-and-click experience so you can quickly find insights in your observability data—no queries or complicated syntax required. Our commitment to that goal remains unchanged, but we’re excited to announce that the Explore apps have a new name: Grafana Drilldown.