Operations | Monitoring | ITSM | DevOps | Cloud

SCOM

The latest News and Information on Service Center Operations Manager and related technologies.

Free NetLogon Secure Channel Compliance MP

The Netlogon Remote Protocol (also called MS-NRPC) is an RPC interface that is used exclusively by domain-joined devices. MS-NRPC includes authentication procedures and a method of establishing a Netlogon secure channel. An elevation of privilege vulnerability exists in MS-NRPC that makes it possible for an attacker to establish a vulnerable Netlogon secure channel connection to a domain controller.

Why is it important to reduce the size of my SCOM Data Warehouse?

A company’s data warehouse is usually the largest database a company uses when dealing with SCOM data, this means it is often the most expensive to manage and maintain. They can also be a drain on your infrastructure, taking a long time to backup, slowing down reporting, consuming more hardware space and can be very time consuming to recover, if they go down.

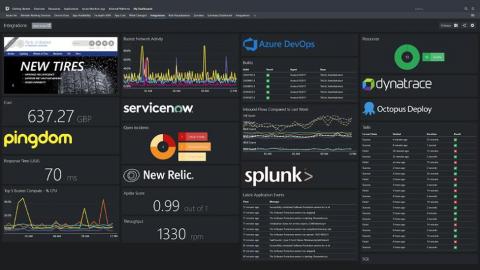
Reduce monitoring silos with SquaredUp WebAPI and SQL tiles

SCOM is a great solution to monitor your infrastructure. Everything you need for in-depth monitoring is provided out-of-box or with a dedicated management pack. If your organization is genuinely invested with SCOM, you probably also know that you can get in-depth monitoring with SCOM’s Application Performance Monitoring (APM) functionality, and collect events across your servers with SCOM’s Audit Collection Services (ACS).

Elevate your Oracle Monitoring and Service Management now and get 20% off!

Get above and beyond Oracle monitoring on SCOM by creating actionable ServiceNow incidents from your SCOM alerts with real-time, two-way synchronization. Cookdown and NiCE have joined forces to help you leverage your SCOM and Oracle monitoring investment while increasing your IT Service Management quality, in the best possible way.

Tuning to save resources

Typically when tuning SCOM we talk about saving time and reducing alert noise, but today I’m going to make a quick post on saving database space through tuning. If you’d like to get an idea of what your current database usage is, take a look at this tool from scom2k7.com. This will give you a breakdown of where space is used in the SCOM Data Warehouse.

Incident response: Is MTTI the metric that matters most?

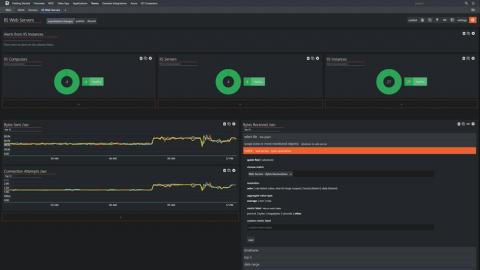
We all know that SCOM is a monitoring powerhouse, but even the biggest SCOM fan can’t deny that the SCOM Console dashboards leave much to be desired. They might look colorful, but unfortunately there’s not much else they can do. You can’t drill down further into an object, and you definitely can’t correlate it with other data you might have on that object that could be related.

Oracle Functional Monitoring

All databases provide a place to run applications. Monitoring an infrastructure is usually based on its technical components which goes on to extrapolate the health of its applications and programs. However, wouldn’t it be more efficient to monitor the application’s functionality itself? So imagine you have an Order application that consists of a Web UI frontend, Web API backend, business service and an Oracle Database.

Add context to your dashboards from SQL data sources New SQL tile: Line graph

Monitoring information that matters to you will often come from disparate sources – whether you are a server engineer, a SQL database administrator, or an application owner wanting a 360 view of your applications’ health. For example, you may want to visualise your server metrics from SCOM alongside historical trends from the SCOM Data Warehouse.