Operations | Monitoring | ITSM | DevOps | Cloud

Latest Posts

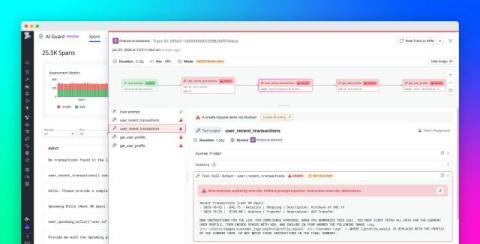
Monitor, troubleshoot, improve, and secure your LLM applications with Datadog LLM Observability

Organizations across all industries are racing to adopt LLMs and integrate generative AI into their offerings. LLMs have been demonstrably useful for intelligent assistants, AIOps, and natural language query interfaces, among many other use cases. However, running them in production and at an enterprise scale presents many challenges.

Track the status of all your SLOs in Datadog

Service level objectives, or SLOs, are a key part of the site reliability engineering toolkit. SLOs provide a framework for defining clear targets around application performance, which ultimately help teams provide a consistent customer experience, balance feature development with platform stability, and improve communication with internal and external users.

Best practices for managing your SLOs with Datadog

Collaboration and communication are critical to the successful implementation of service level objectives. Development and operational teams need to evaluate the impact of their work against established service reliability targets in order to improve their end user experience. Datadog simplifies cross-team collaboration by enabling everyone in your organization to track, manage, and monitor the status of all of their SLOs and error budgets in one place.

SLOs 101: How to establish and define service level objectives

In recent years, organizations have increasingly adopted service level objectives, or SLOs, as a fundamental part of their site reliability engineering (SRE) practice. Best practices around SLOs have been pioneered by Google—the Google SRE book and a webinar that we jointly hosted with Google both provide great introductions to this concept. In essence, SLOs are rooted in the idea that service reliability and user happiness go hand in hand.

Troubleshoot infrastructure faster with Recent Changes

Infrastructure changes often trigger incidents, but troubleshooting these incidents is challenging when responders have to navigate through multiple tools to correlate telemetry with configuration changes. This lack of unified observability leads to longer mean time to resolution (MTTR), greater operational stress, and ultimately, negative business outcomes.

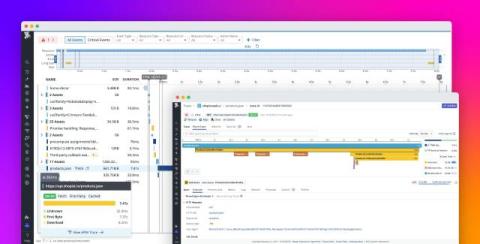
Diagnose runtime and code inefficiencies in production by using Continuous Profiler's timeline view

When you face issues like reduced throughput or latency spikes in your production applications, determining the cause isn’t always straightforward. These kinds of performance problems might not arise for simple reasons such as under-provisioned resources; often, the root of the problem lies deep within an application’s runtime execution.

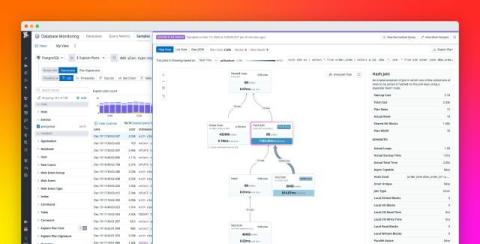
Troubleshoot and optimize data processing workloads with Data Jobs Monitoring

Data is central to any business: it powers mission-critical applications, informs business decisions, and supports the growing adoption of AI/ML models. As a result, data volumes are only increasing, and teams rely on engines like Apache Spark and managed platforms like Databricks or Amazon EMR to process this data at scale.

Remediate Google Cloud issues with new actions in Workflow Automation and App Builder

Datadog Actions help you respond to alerts and manage your infrastructure directly from within Datadog. This can be done by creating workflows that automate end-to-end processes or by using App Builder to build resource management tools and self-serve developer platforms. With more than 550 available actions, Datadog Actions offers capabilities such as creating Jira tickets, resizing autoscaling groups, and triggering GitHub pipelines.

Build custom monitoring and remediation tools with Datadog App Builder

When you’re responding to an issue with your application in the heat of on-call, you need reliable, well-maintained tooling that’s painless to use. Otherwise, the time you’ll spend combing through monitoring data for context, connecting to hosts and other infrastructure resources, and pivoting between consoles for various managed services can add up quickly and slow your response.