If one of your KPIs is how many backup failures you had, and you're not regularly reaching a goal of 0, you're putting lipstick on a pig when it comes to backup.
Sematext has undergone some amazing updates this year. In this episode of Sematext Update Review (SUR), we will look at these features in detail and how they can help you monitor your full stack. Sematext is an all-in-one monitoring solution for your IT stack. Monitor Logs, Infrastructure, synthetic runs, or real user experiences all in one place.
Serverless360 is a cloud management platform engineered for Microsoft Azure that brings enterprise-grade monitoring, tracing, remediation & governance under one roof. Everything you need to empower your Azure operations teams with more meaningful features and deliver effortless support.
Serverless360 is a cloud management platform engineered for Microsoft Azure that brings enterprise-grade monitoring, tracing, remediation & governance under one roof. Everything you need to empower your Azure operations teams with more meaningful features and deliver effortless support.
Serverless360 is a cloud management platform engineered for Microsoft Azure that brings enterprise-grade monitoring, tracing, remediation & governance under one roof. Everything you need to empower your Azure operations teams with more meaningful features and deliver effortless support.
Live from New York, it’s Grafana ObservabilityCON! Join CEO/Co-founder Raj Dutt, VP of Technology Tom Wilkie, and members of the Grafana Labs engineering team for a look at the latest developments in the open and composable LGTM (Loki-Grafana-Tempo-Mimir) observability stack. Spoiler alert: There will be some exciting announcements!
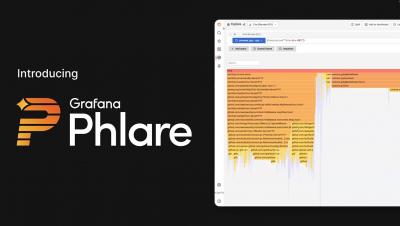
A quick overview of Grafana Phlare, a new open source database for continuous profiling at massive scale. Plus a look at the new flame graph panel in Grafana.
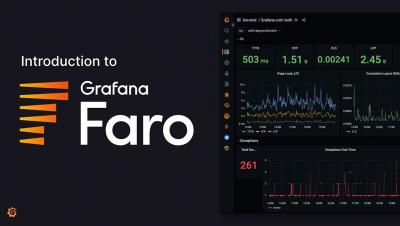
A brief overview about the Grafana Faro Web SDK, a highly configurable open source JavaScript agent that can easily be embedded in web applications to collect real user monitoring (RUM) data: performance metrics, logs, exceptions, events, and traces.
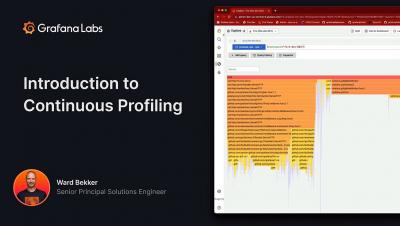
In this video, we will review the advantages of continuous profiling, the difference between continuous profiling vs. traditional profiling, and how continuous profiling can fit into your overall observability strategy. You’ll also learn more about Grafana Phlare, the new open source continuous profiling database, and get a look at the latest flame graph visualization in Grafana.