Operations | Monitoring | ITSM | DevOps | Cloud

The latest News and Information on Observabilty for complex systems and related technologies.

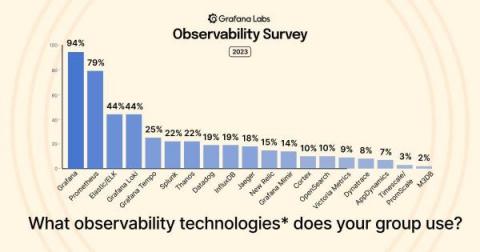
5 key takeaways from the Grafana Labs Observability Survey 2023

Observability is coming into its own, as SREs and DevOps practitioners increasingly seek to centralize the sprawl of tools and data sources to better manage their workloads and respond to incidents faster — and to save time and money in the process. That was the overarching message from more than 250 observability practitioners who took part in the Grafana Labs’ first ever Observability Survey.

Data Gravity in Cloud Networks: Distributed Gravity and Network Observability

So far in this series, I’ve outlined how a scaling enterprise’s accumulation of data (data gravity) struggles against three consistent forces: cost, performance, and reliability. This struggle changes an enterprise; this is “digital transformation,” affecting everything from how business domains are represented in IT to software architectures, development and deployment models, and even personnel structures.

Caring for Complex Systems: We Can Do This

When we work at it, professionals are pretty good at analysis. We can break down a simple system, look at its parts and their relations, and master it. Given enough time and teammates, we can analyze a very complicated system and fix it when it breaks. But complex systems don’t yield to analysis. We have to add another skill: sense-making. Complex systems have parts that learn and change, with relations that vary with state and history. They respond to and influence their environment.

How Can You Optimize Business Cost and Performance With Observability?

Businesses are increasingly adopting distributed microservices to build and deploy applications. Microservices directly streamline the production time from development to deployment; thus, businesses can scale faster. However, with the increasing complexity of distributed services comes visual opacity of your systems across the company. In other words, the more complex your system gets, the harder it becomes to visualize how it works and how individual resources are allocated.

Debugging Serverless Functions with Lightrun

Developers are increasingly drawn to Functions-as-a-Service (FaaS) offerings provided by major cloud providers such as AWS Lambda, Azure Functions, and GCP Cloud Functions. The Cloud Native Computing Foundation (CNCF) has estimated that more than four million developers utilized FaaS offerings in 2020. Datadog has reported that over half of its customers have integrated FaaS products in cloud environments, indicating the growth and maturity of this ecosystem.

Understanding Distributed Tracing with a Message Bus

So you're used to debugging systems using a distributed trace, but your system is about to introduce a message queue—and that will work the same… right? Unfortunately, in a lot of implementations, this isn't the case. In this post, we'll talk about trace propagation (manual and OpenTelemetry), W3C tracing, and also where a trace might start and finish.

Observability from Development to Production with Platform.sh Observability

With Platform.sh and Blackfire.io monitor, profile and test your application even before it is released in production. Get actionable insights to improve your code rather than spend time figuring out what’s wrong. Ensure optimal performance and user experience for your web applications.