Operations | Monitoring | ITSM | DevOps | Cloud

The latest News and Information on Log Management, Log Analytics and related technologies.

Loki quick tip: How to use a Loki datasource in your Grafana dashboard

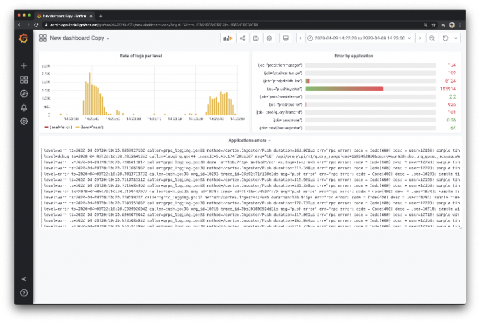
In Grafana, Loki isn’t just for log visualization anymore. Now there’s a simple way to use a Loki datasource as a metric datasource in your graphs. This used to require a hack to make it work – adding Loki as a Prometheus datasource – and the process was very tedious. But Grafana v6.6 integrates Loki even better than before. As a result, right out of the box you can create very nice dashboards about your logs, and mix them with your dashboards about metrics.

Logz.io Infrastructure Monitoring: Configuring Alerts and Log-Metric Correlation

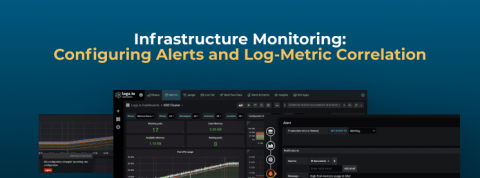
If you’ve followed our latest blog posts, you’ll have learned how to send metric data to Logz.io and visualize that data on Infrastructure Monitoring – our Grafana-based metrics monitoring solution that we made Generally Available on Monday. At this point you’ll have some nice looking Grafana dashboards in your account.

Generating MITRE ATT&CK® signals in Elastic SIEM: Sysmon data

Many mature security teams look to the MITRE ATT&CK® matrix to help improve their understanding of attacker tactics, techniques, and procedures (TTPs) and to better understand their own capabilities relative to these common adversarial approaches. With the release of Elastic Security 7.6, Elastic SIEM saw 92 detection rules for threat hunting and security analytics aligned to ATT&CK.

Stop the world, I want to get off. Oh! It stopped...

Sitting here in my home office reflecting the potential problems the world faces both in the short term and longer term, I can’t help but think back to my career before coming to Splunk. That time was spent on the ground working ‘in the real world’, maintaining the operational and security state of systems and networks. I can empathise with the huge pressures the entire IT chain from CIOs, CISOs, IT Managers and IT admins are under right now.

Logz.io Infrastructure Monitoring: Building Grafana Visualizations

Yesterday, my colleague Mike Elsmore wrote a blog about sending metrics to Logz.io Infrastructure monitoring – now let’s analyze them by building Grafana visualizations! Once you’ve started to send metric data to Logz.io, how do you visualize and interpret that data so that it’s useful for you? In Logz.io Infrastructure Monitoring, we use Grafana to provide dashboards and bring meaningful information to light.

Elastic Cloud Enterprise 2.5: Dedicated coordinating layer, snapshot lifecycle management, and more

We’re excited to announce the release of Elastic Cloud Enterprise (ECE) 2.5! This release improves the experience of managing your deployments with a dedicated coordinating layer, support for snapshot lifecycle management (SLM), and more.

Helping Your Remote NOC Teams Work Better Together

In light of COVID-19 related office closures, one thing we’ve seen and heard repeatedly is the “abandoned NOC.” People that are responsible for finding, escalating and resolving problems in your infrastructure and applications quickly are now having to work very differently. Two-minute hallway conversations are replaced with time-consuming emails, Slack, and virtual calls.

Continuously manage your CircleCI implementation with Coralogix

For many companies today business success depends on quality efficient build, test and delivery processes. Development and deployment environments become complex very quickly, even for small and medium companies. A contributing factor to this complexity is companies’ adoption of microservices. This is where modern CI/CD solutions like CircleCI come in to help streamline these processes.

Performance Best Practices: Running and Monitoring Express.js in Production

What is the most important feature an Express.js application can have? Maybe using sockets for real-time chats or GraphQL instead of REST APIs? Come on, tell me. What’s the most amazing, sexy, and hyped feature you have in your Express.js application? Want to guess what mine is? Optimal performance with minimal downtime. If your users can’t use your application, what’s the point of fancy features?