Operations | Monitoring | ITSM | DevOps | Cloud
Twelve-Factor Apps and Modern Observability
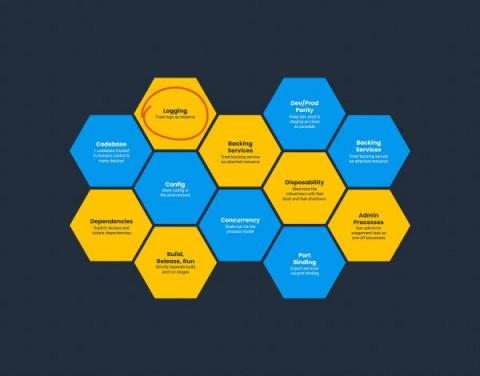
The Twelve-Factor App methodology is a go-to guide for people building microservices. In its time, it presented a step change in how we think about building applications that were built to scale, and be agnostic of their hosting. As applications and hosting have evolved, some of these factors also need to. Specifically, factor 11: Logs (which I’d also argue should be a lot higher up in the ordering).
Trace at Your Own Pace: Three Easy Ways to Get Started with Distributed Tracing
Learn How NS1 Uses Distributed Tracing to Release Code More Quickly and Reliably
Making the Case: The Business Value of Observability
Discover Unknown Service Interaction Patterns With Istio & Honeycomb
See How Coveo Engineers Reduced User Latency
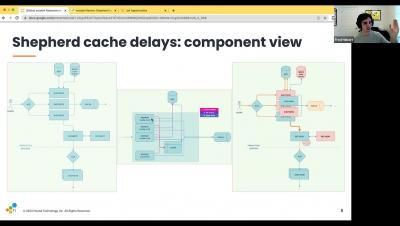
Join Jeli and Honeycomb for an Incident Response and Analysis Discussion
Learn How SumUp Implemented SLOs to Mitigate User Outages and Reduce Customer Churn
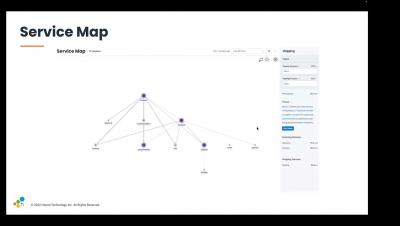
Learn to Leverage Service Maps with Honeycomb
Surface and Confirm Buggy Patterns in Your Logs Without Slow Search
Honeycomb and OTel Demo
Ask Miss O11y: Is There a Beginner's Guide On How to Add Observability to Your Applications?
I want to make my microservices more observable. Currently, I only have logs. I’ll add metrics soon, but I’m not really sure if there is a set path you follow. Is there a beginner's guide to observability of some sort, or best practice, like you have to have x kinds of metrics? I just want to know what all possibilities are out there. I am very new to this space.
How Do We Cultivate the End User Community Within Cloud-Native Projects?
The open source community talks a lot about the problem of aligning incentives. If you’re not familiar with the discourse, most of this conversation so far has centered around the most classic model of open source: the solo unpaid developer who maintains a tiny but essential library that’s holding up half the internet. For example, Denis Pushkarev, the solo maintainer of popular JavaScript library core-js, announced that he can’t continue if not better compensated.
Platform Engineering Is the Future of Ops
How We Define SRE Work, as a Team
Last year, I wrote How We Define SRE Work. This article described how I came up with the charter for the SRE team, which we bootstrapped right around then. It’s been a while. The SRE team is now four engineers and a manager. We are involved in all sorts of things across the organization, across all sorts of spheres. We are embedded in teams and we handle training, vendor management, capacity planning, cluster updates, tooling, and so on.
Feature Focus: Winter Edition
It’s been a minute since our last Feature Focus, and we have a bit of catching up to do! I’m happy to report we’ll resume monthly updates next month, but until then, please enjoy this super-sized winter digest of what we’ve been up to at Honeycomb.
Deploys Are the WRONG Way to Change User Experience
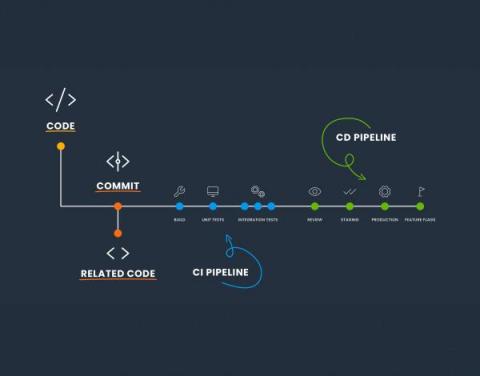
I'm no stranger to ranting about deploys. But there's one thing I haven't sufficiently ranted about yet, which is this: Deploying software is a terrible, horrible, no good, very bad way to go about the process of changing user-facing code. It sucks even if you have excellent, fast, fully automated deploys (which most of you do not). Relying on deploys to change user experience is a problem because it fundamentally confuses and scrambles up two very different actions: Deploys and releases.
How Coveo Reduced User Latency and Mean Time to Resolution with Honeycomb Observability
When you’re just getting started with observability, a proof of concept (POC) can be exactly what you need to see the positive impact of this shift right away. Coveo, an intelligent search platform that uses AI to personalize customer interactions, used a successful POC to jumpstart its Honeycomb observability journey—which has grown to include 10,000+ machine learning models in production at any one time. Wondering how Coveo got there? So were we.
Caring for Complex Systems: We Can Do This
When we work at it, professionals are pretty good at analysis. We can break down a simple system, look at its parts and their relations, and master it. Given enough time and teammates, we can analyze a very complicated system and fix it when it breaks. But complex systems don’t yield to analysis. We have to add another skill: sense-making. Complex systems have parts that learn and change, with relations that vary with state and history. They respond to and influence their environment.
Understanding Distributed Tracing with a Message Bus
So you're used to debugging systems using a distributed trace, but your system is about to introduce a message queue—and that will work the same… right? Unfortunately, in a lot of implementations, this isn't the case. In this post, we'll talk about trace propagation (manual and OpenTelemetry), W3C tracing, and also where a trace might start and finish.
How 3 Companies Implemented Distributed Tracing for Better Insight into Their Systems
Distributed tracing enables you to monitor and observe requests as they flow through your distributed systems to understand whether these requests are behaving properly. You can compare tiny differences between multiple traces coming through your microservices-based applications every day to pinpoint areas that are affecting performance. As a result, debugging and troubleshooting are simpler and faster.


