Operations | Monitoring | ITSM | DevOps | Cloud

August 2021

Elastic and Cmd join forces to help you take command of your cloud workloads

We are excited to announce that Elastic is joining forces with Cmd to accelerate our efforts in Cloud security - specifically in cloud workload runtime security. By integrating the capabilities of Cmd's expertise and product into Elastic Security, we will enable customers to detect, prevent, and respond to attacks on their cloud workloads.

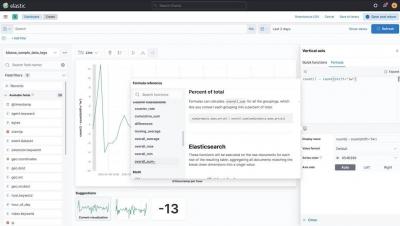
How to use Kibana time shifts, advanced formulas, and dynamic colors

Ad hoc analysis capabilities in Kibana enable you to visualize your time series data easily and intuitively. In this video, learn how to use time shifts, advanced formulas, and dynamic colors in Kibana to examine data over different time periods, author your own metrics to use in visualizations, and highlight important values in tables.

New Google Cloud instance types on Elastic Cloud

We are excited to announce support for Google Compute Engine (GCE) N2 general purpose virtual machine (VM) types, and additional hardware configuration options powered by N2 custom machine types. N2 VMs leverage Intel 2nd Generation Xeon Scalable processors and provide a balance of compute, memory, and storage. N2 machine types also offer more than a 20% improvement in price-performance over the first-generation N1 machines.

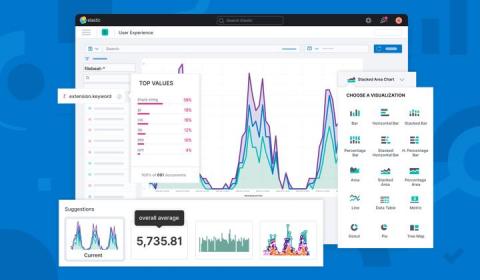
10 common questions answered with formulas and time travel in Kibana

Kibana creates easy ways to do powerful things with all of your data — to ask and answer questions and follow the flow of analysis. Many times the answer to your question requires calculations based on queried data. Formulas allow you to author your own metrics by combining multiple aggregated fields using math operations. In addition, moving through and replaying your data in time and space are powerful ways to gain historical context and understand additional insight about the present.

Full-cycle observability with the Elastic Stack and Lightrun

An application running in production is a difficult beast to tame. Most experienced developers–ones who spent enough late nights or Saturday mornings trying to break apart a nasty production bug–will try and create the clearest possible picture for their later selves while writing their code, so that they could understand what’s actually going on in the system during an incident.

Read active log files more quickly and easily with the new filestream input in Filebeat

With Elastic 7.14, the filestream input, the successor of log input, is now generally available in Filebeat. This new, superior input provides better support for reading active log files, with faster reaction time when there is backpressure in the system, quicker registry updates, better cooperation with external log rotation tools, and more.

Preparing for the Elastic Certified Observability Engineer Exam - Get Elasticsearch Certified

The Elastic Certified Observability Engineer exam tests your knowledge and skills on using the Elastic Stack to implement observability, from ingesting metrics, logs, APM and uptime data to a single data source, to analyzing and reacting to events using Kibana, machine learning, and alerting.

Elastic recognized for innovation by Google Cloud and Microsoft

Elastic received honors from two key partners, Microsoft and Google — a recognition of our efforts to ensure that customers can easily find and use Elastic products in the environments that best suit their needs. Elastic was named the 2021 Microsoft US Partner Award Winner in Business Excellence in the Commercial Marketplace. In addition, for the second year in a row, Elastic was selected by Google Cloud as the 2020 Technology Partner of the Year for Data Management.

Elastic Agent and Fleet make it easier to integrate your systems with Elastic

Today, we are happy to announce three major improvements that will make it easier to integrate your systems and applications with the Elastic Stack. First, we are launching the generally available (GA) release of our Elastic Agent, which is a single, unified agent for both observability and security. A unified agent will simplify data onboarding with fewer things to configure and install.

Elastic 7.14.0 introduces the industry's first free and open Limitless XDR

We are pleased to announce the general availability (GA) of Elastic 7.14, including our Elastic Enterprise Search, Observability, and Security solutions, which are built into the Elastic Stack — Elasticsearch and Kibana. Elastic 7.14 empowers organizations with the first free and open Limitless XDR, which delivers unified SIEM and endpoint security capabilities in one platform.

Limitless XDR defined: Ingest, retain, and analyze security data freely

Elastic Security's newest features define the potential of XDR for cybersecurity teams. Our single platform brings together SIEM and endpoint security, allowing users to ingest and retain large volumes of data from diverse sources, store and search data for longer, and augment threat hunting with detections and machine learning. Security vendors are using the term “XDR” with increasing frequency, applying varied definitions to suit their respective technologies.

Save 10% disk space on your logging datasets with match_only_text

Elasticsearch 7.14 introduces match_only_text, a new field type that can be used as a drop-in replacement for the text field type in logging use cases with a much lower disk footprint, leading to lower costs. Elasticsearch is attractive for log analysis thanks to its ability to index log messages. Want to count how many log messages contain access denied in the last 24 hours?