Operations | Monitoring | ITSM | DevOps | Cloud

Tracing

The latest News and Information on Distributed Tracing and related technologies.

How to use OpenTelemetry for Kafka Monitoring

Apache Kafka is a high-throughput, low-latency platform for handling real-time data feeds. Its storage layer is in essence a massively scalable pub/sub message queue designed as a distributed transaction log. It can be used to process streams of data in real-time, building up a commit log of changes. Kafka has strong ordering guarantees that enable it to handle all sorts of dataflow patterns including very low latency messaging and efficient multicast publish / subscribe.

Running the OpenTelemetry Collector in Azure Container Apps

In this post, we’ll look at how to host the OpenTelemetry Collector in Azure Container Apps. There are a few gotchas with how it’s deployed, so hopefully this will stop you from hitting the same issues. If you don’t care about the details and just want to run a script, I’ve created one here.

What is Distributed Tracing vs OpenTelemetry?

There are a few key differences between distributed tracing and OpenTelemetry. One is that OpenTelemetry offers a more unified approach to instrumentation, while distributed tracing takes a more granular approach. This means that OpenTelemetry can be less time-consuming to set up, but it doesn’t necessarily offer as much visibility into your system as distributed tracing does.

Distributed Tracing Observability in Microservices

Have you ever tried to find a bug in a multi-layered architecture? Although this might sound like a simple enough task, it can quickly become a nightmare if the system doesn’t have proper monitoring. And the more distributed your system is, the more complex it becomes to analyze the root cause of a problem. That’s precisely why observability is key in distributed systems. Observability can be thought of as the advanced version of application monitoring.

What Does OpenTelemetry Mean for Companies Trying to Change?

Big data experts already agree that the amount of generated data is growing exponentially and forecast that it will reach 175 zettabytes by 2025. That projection is predicated upon current realities, which include a growing number of internet users and the billions of embedded systems and connected devices around the world. Even conceptualizing that amount of data is daunting — but then consider how best to manipulate and export it.

How to Monitor Aerospike with OpenTelemetry

With observIQ’s latest contributions to OpenTelemetry, you can now use free open source tools to easily monitor Aerospike. The easiest way to use the latest OpenTelemetry tools is with observIQ’s distribution of the OpenTelemetry collector. You can find it here. In this blog, the Aerospike receiver is configured to monitor metrics locally with OTLP–you can use the Aerospike receiver to ship metrics to many popular analysis tools, including Google Cloud, New Relic, and more.

What is N+1 query problem and how distributed tracing solves it?

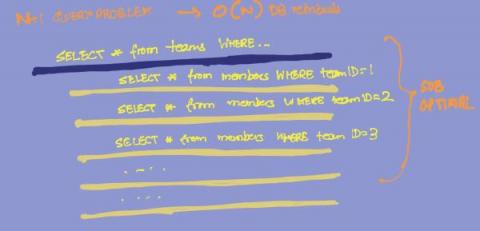
N+1 query problem is a problem in database retrieval where the related entities of an object are queried individually from a database, leading to O(n) queries where n is the number of related entities of the object. Mouthful of words, I agree 🙂 Let’s take an example to illustrate what it means.

What Are Spans in Distributed Tracing?

Distributed tracing is an essential process in the modern world of cloud-based applications. Tracing tracks and observes each service request an application makes across distributed systems. Developers may find distributed tracing most prevalent in microservice architectures where user requests pass through multiple services before providing the desired results.