Operations | Monitoring | ITSM | DevOps | Cloud

Grafana

How to configure OpenTelemetry .NET Automatic Instrumentation with Grafana Cloud

For those who have limited experience with OpenTelemetry, it can be intimidating to instrument.NET applications. But the OpenTelemetry community created a welcome shortcut with the first stable release of.NET Automatic Instrumentation. It simplifies the process of collecting metrics, logs, and traces from your.NET applications, without applying any changes to the source code or adding any dependencies to the OSS project.

Create a logs app plugin with Grafana Scenes and Grafana Loki

Grafana’s plugin tools help developers extend Grafana’s core functionality and create plugins faster, with a modern build setup and zero configuration. Grafana Scenes, meanwhile, is a new front-end library, introduced with Grafana 10, that enables developers to create dashboard-like experiences — such as querying and transformations, dynamic panel rendering, and time ranges — directly within Grafana application plugins.

How to integrate a Spring Boot app with Grafana using OpenTelemetry standards

Maciej Nawrocki, Senior Backend Developer at Bright Inventions, is a backend developer focused on DevOps and monitoring. Adam Waniak, Senior Backend Developer at Bright Inventions, is a backend developer with a keen interest in DevOps. Bright Inventions is a software consulting studio based in Gdansk, Poland, with expertise in mobile, web, blockchain, and IOT systems. At Bright Inventions, we always prioritize app optimization when we develop software solutions for our clients.

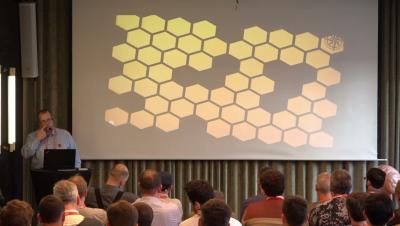
Real user monitoring with Grafana (Grafana Office Hours #17)

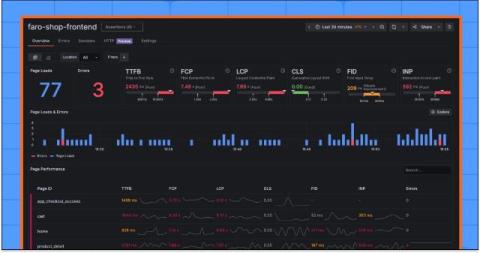
Have you heard of Grafana Faro and how it can help in providing insights into your real user experience? Developer Advocates Nicole van der Hoeven and Marie Cruz chat with Software Engineers Kostas Pelelis and Marco Schaefer to discuss what Grafana Faro is, why it's important to have a real user monitoring solution, and how to get started with Grafana Faro.

Grafana panel title generator, interactive visualizations, and more

Dive deep into the enhancements in Grafana 10.2. From embedding interactive buttons within Canvas visualizations to utilizing AI for dashboard titles and descriptions, this release brims with features designed to optimize your Grafana experience. In this video, discover how to: Stay with us through this playlist to delve deeper into each addition and maximize your Grafana 10.2 experience.

How to navigate alerting insights in Grafana Cloud

Navigate your alerting systems in Grafana Cloud with the new Alerting Insights feature. This enhanced landing page provides a comprehensive view of your alerting data, from Grafana managed rules to Mimir managed rules, and highlights critical trends in your organization's alert management performance.

The Grafana developer portal: your gateway to enhanced plugin development

As Grafana continues to evolve, we remain dedicated to improving the experience for Grafana users, as well as the developers building applications on top of the platform. Today, we are delighted to introduce the next step in that evolution, the all-new Grafana developer portal — a central hub of curated resources for developers who want to extend Grafana’s capabilities.

The benefits of web performance testing with Grafana k6 browser and Grafana Faro

Performance tests created with the Grafana k6 browser module use lab data collected from pre-defined environments, devices, and network settings. Lab data allows you to repeatedly reproduce performance results, making it useful for detecting and fixing performance issues early. Lab data, however, doesn’t account for one very important testing component: real user experience.

Grafana 10.2 release: Grafana panel title generator, interactive visualizations, and more

Grafana 10.2 is here! Download Grafana 10.2 As always, the latest version of Grafana includes a ton of dashboard and data visualization improvements. You can add interactive buttons to your Canvas visualizations; auto-generate dashboard panel titles, and descriptions using AI; and zoom in on specific y-axis values in your time series.